
Los Angeles (CoinChapter) – The price of Bitcoin plummeted more than 15% over the weekend after reaching a record high of $64,863 on April 14. The surge was sparked by major crypto exchange Coinbase’s listing on the Nasdaq Stock Market.
However, the rally was short-lived as traders decided to secure their profits. The Bitcoin price consequently dipped below $54,000, and most altcoins saw their value plunge as well.
Dip-buying at local support levels helped Bitcoin avoid a full-fledged bearish assault. It has since pared some of its losses and is currently trading above $56,000.
So what does the short-term future look like for Bitcoin in the wake of a hectic week? All signs point to the bull market continuing.
#1 Dormancy Flow Bullish
One of the most useful ways to analyze where the Bitcoin price stands are by looking at long-term holders‘ behavior. Typically, long-term investors begin to sell off into strength during the final parabolic pushes of the run at the end of bull cycles.
The data shows we are nowhere near that stage yet. One of the best metrics that illustrates this is dormancy.
In retrospect, the said metric illustrates the amount of dormancy in the coins being sold onto the market. Older coins (coins that have not moved) hold more dormancy.
There is lower dormancy in bear markets as long-term investors scoop up cheap coins without selling. Higher prices make it worthwhile to sell, on the flip side, which is why dormancy rises in bull markets.
The chart below shows the historical peaks of dormancy that Bitcoin has reached in previous bull cycles:
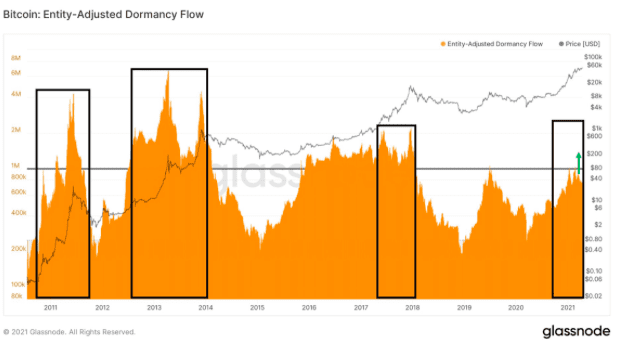
By comparison, the current trend still has a lot of room for growth.
#2 HODL Waves
Another metric that can be used to follow holding behavior is HODL Waves. This analyzes the behavior of different “aged” coins.
Each colored band shows the percentage of Bitcoin tokens in existence moved within a specific time period. In bear markets, short-term investors leave, and long-term holders take up a larger supply portion.
The opposite is true in a bull market, as the chart below shows:
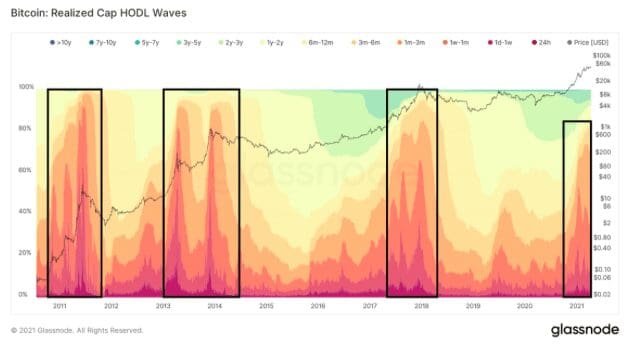
By comparison, HODL Waves shows a lot of room upwards for the current bull cycle.
#3 Illiquid Bitcoin Supply
Another long-term metric to look at when determining the outlook of the Bitcoin price is the illiquid supply. This is considered the supply in wallet addresses that has not been moved for at least six months.
The huge draw that is currently being seen represents the Bitcoin supply purchased last November and December, as they cross the “illiquid” threshold now.
Supply has become consistently become illiquid throughout the entire bull market. Coins continue to be scooped up by strong hand wallets with no intention of selling for short-term gains.
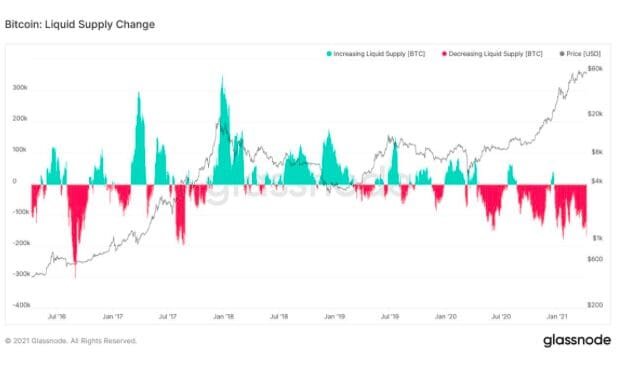
The current levels of illiquidity are unprecedented in terms of Bitcoin’s historical data.

… [Trackback]
[…] Info on that Topic: coinchapter.com/3-reasons-why-bitcoin-bull-market-is-not-over/ […]
… [Trackback]
[…] Read More Information here on that Topic: coinchapter.com/3-reasons-why-bitcoin-bull-market-is-not-over/ […]
… [Trackback]
[…] Read More Info here on that Topic: coinchapter.com/3-reasons-why-bitcoin-bull-market-is-not-over/ […]