Key Takeaways:
- Crypto AI tokens have taken bullish cues from the hype around AI apps like ChatGPT.
- LAT, ORAI, and SDAO have formed bullish patterns, while FET and AGIX leverage use cases for bullish

NEW DELHI (CoinChapter.com) — The rise of AI-based apps like ChatGPT has buoyed crypto AI projects. As a result, crypto projects Fetch.AI, SingularityNET, OraiChain, PlatON, and SingularityDAO have enjoyed significant YTD gains in 2023.
The AI crypto tokens have been expanding their ecosystem and advancing their use cases to increase their adoption. Furthermore, as other major tech giants enter the AI race, the demand for crypto AI services would likely spike due to their use cases.
For example, Fetch.AI helps expand digitization with minimal human interference, while SingularityNET is a blockchain-based AI marketplace where users can create, share, and monetize AI-related services.
1. Fetch.AI’s FET Price Rally Sees 332% YTD Gains
Fetch.AI provides programmers with the platform and resources to build autonomous agents to help improve areas such as transportation, industry, etc.
Additionally, the blockchain platform allows creators to create decentralized economic models without intermediaries. Web 3.0 developers might also leverage the Fetch.AI ecosystem for creating dApps and other services.
The platform’s native token FET rose 289% YTD to a daily high of $0.35 on March 28. However, the uptrend flattened out around Feb 7, forcing Fetch.AI prices to fall below their 20-day EMA (red wave) and 50-day EMA (purple wave) resistance confluence.
The wider market’s bearish cues forced the Fetch.AI token to breach the dynamic support zone near its 50-day EMA. Though the FET price painted a relief rally, a multi-week descending trendline rebuffed Fetch.AI’s upside movement.
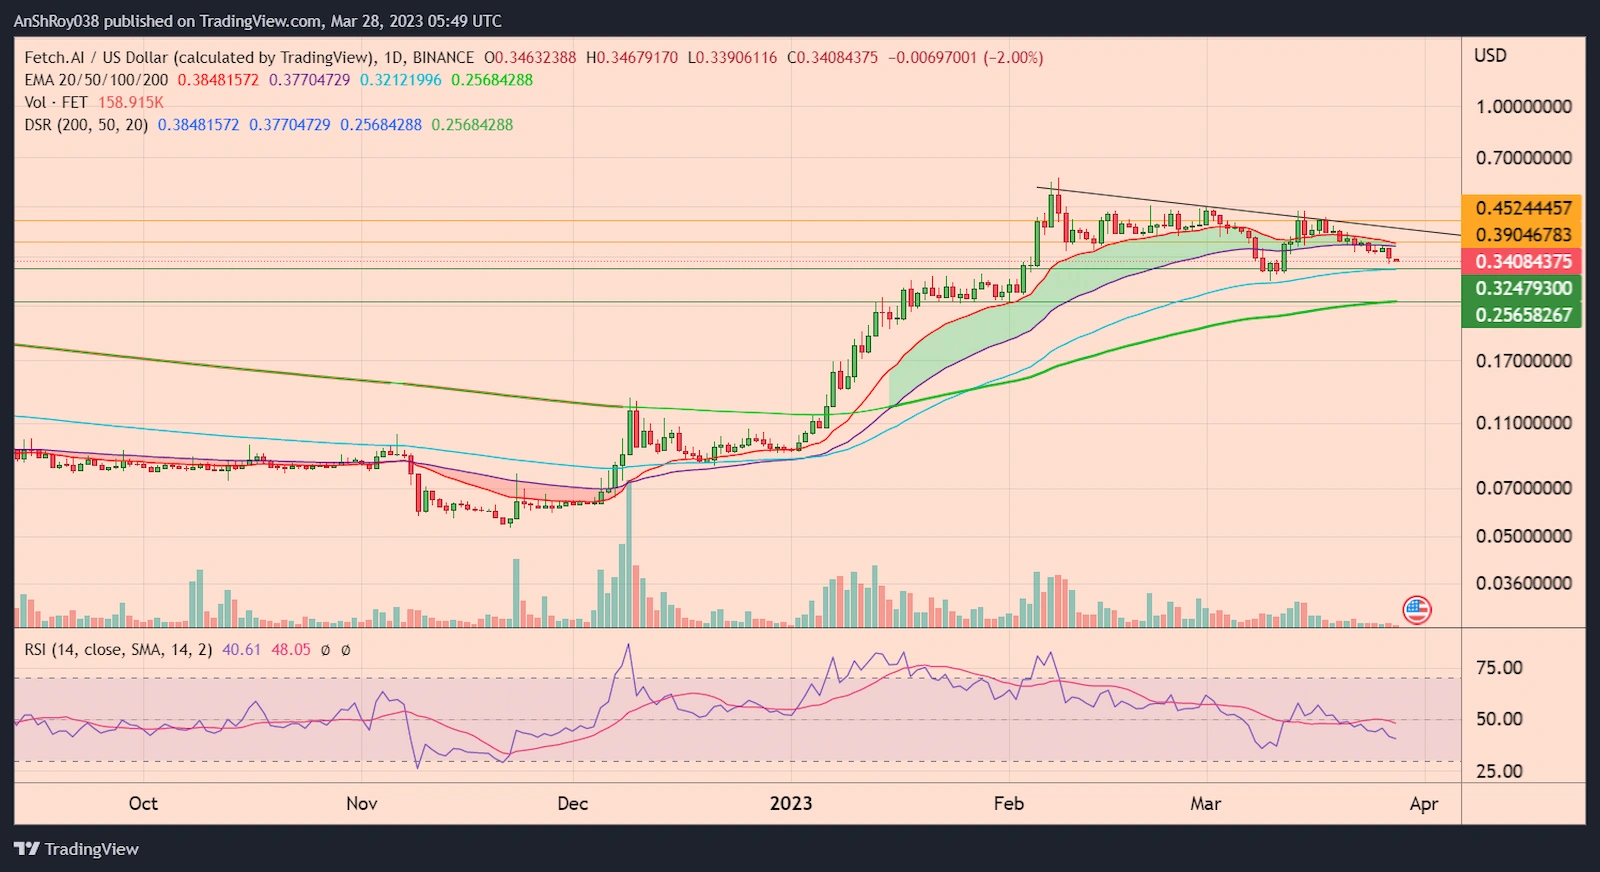
FET bulls failed to hold the token’s price above the 50-day EMA support. If the downtrend continues, the FET price might drop to its 100-day EMA (blue wave) support near $0.325.
Moreover, breaching the immediate support could see Fetch.AI dropping to test support from its 200-day EMA (green wave) to reach $0.325.
On the other hand, if bulls manage to defend the EMA support level, the Fetch.AI token will rise to resistance near $0.4. Afterward, bulls would need to break above the descending trendline resistance before targeting resistance near $0.45.
Meanwhile, the RSI remains neutral for FET, clocking at 40.61 daily.
2. AI Marketplace SingularityNET Explodes In 2023
SingularityNET is a blockchain-based AI services marketplace, which rose 1,033% YTD to reach a daily high of $0.51 on March 24. The blockchain platform aims to ensure AI services are easy to develop and accessible to users.
The crypto AI platform has had investors’ interest for some time, with the ICO of its native token, AGIX, raising $36 million in 60 seconds. In addition, SingularityNET provides developers with various AI algorithms to help integrate AI into various applications.
AGIX price dropped 46% from March 1’s high of $0.56 before starting a recovery rally on Mar 12. Long upper wicks on recent AGIX daily candles suggest bearish pressure against the token is rising. The SingularityNET token dropped nearly 13.3% from March 27 to a daily low of $0.47 on March 28.
The momentum oscillator MACD forecasts bullish signals for the AGIX crypto AI token.
Negative bars on the indicator’s histogram are expanding, indicating that the MACD line (difference between 12-day and 26-day EMA) is moving away from the MACD signal line (9-day EMA of MACD). As a result, AGIX formed a bearish crossover on Mar 25.
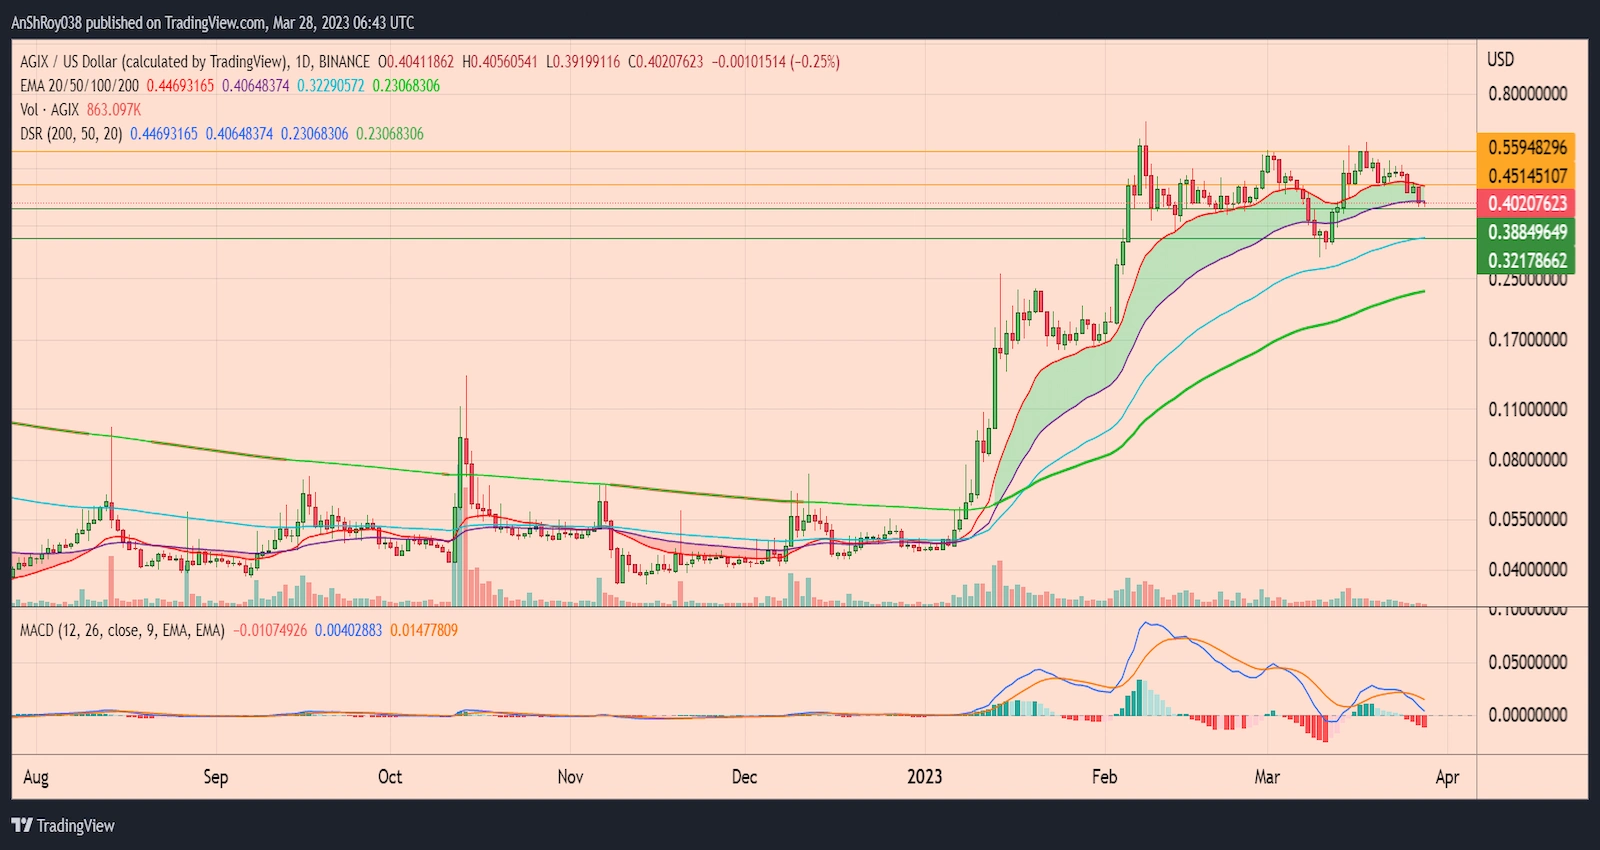
AGIX bulls are trying to defend its 50-day EMA (red wave) resistance near $0.39. However, if the AGIX price breaches the immediate support zone, the token could fall over 20% to test the 100-day EMA (blue wave) support near $0.32 before recovering.
On the other hand, if the SingularityNET token price holds above the immediate support, bulls might try to challenge the 20-day EMA (red wave) resistance near $0.45. A break and hold above immediate resistance could provide AGIX’s price the momentum needed to reach $0.56.
ChatGPT’s success has shed a spotlight on the use cases of AI. Moreover, SingularityNET’s partnerships with CISCO, MLabs, Cardano, etc., would likely benefit AGIX’s price action. As such, SingularityNET would likely benefit from ChatGPT’s success in inviting more developers to the AI sector.
3. Oraichain Token Price Forms Bullish Pattern
Oraichain, which claims to be the first intelligent solution for Web 3 technology, focuses on scalable dApps and decentralized AI. The platform operates on an AI layer one protocol and can operate with other blockchains.
The platform also supports smart contracts and AI APIs. Smart contracts on Oraichain make use of AI models. AI-enabled smart contracts might attract developer activity to the blockchain, while AI APIs would help developers introduce AI capabilities in existing applications.
Also Read: El Salvador’s Bitcoin (BTC) Friendly President Nayib Bukele Will Eliminate Taxes on Tech SectorMeanwhile, ORAI, the blockchain’s in-house token, formed a bullish technical pattern called the bull flag. Assets with strong uptrends usually form the pattern. Bull flags consist of a flag pole, resulting from a near-vertical rise in the crypto token’s prices.
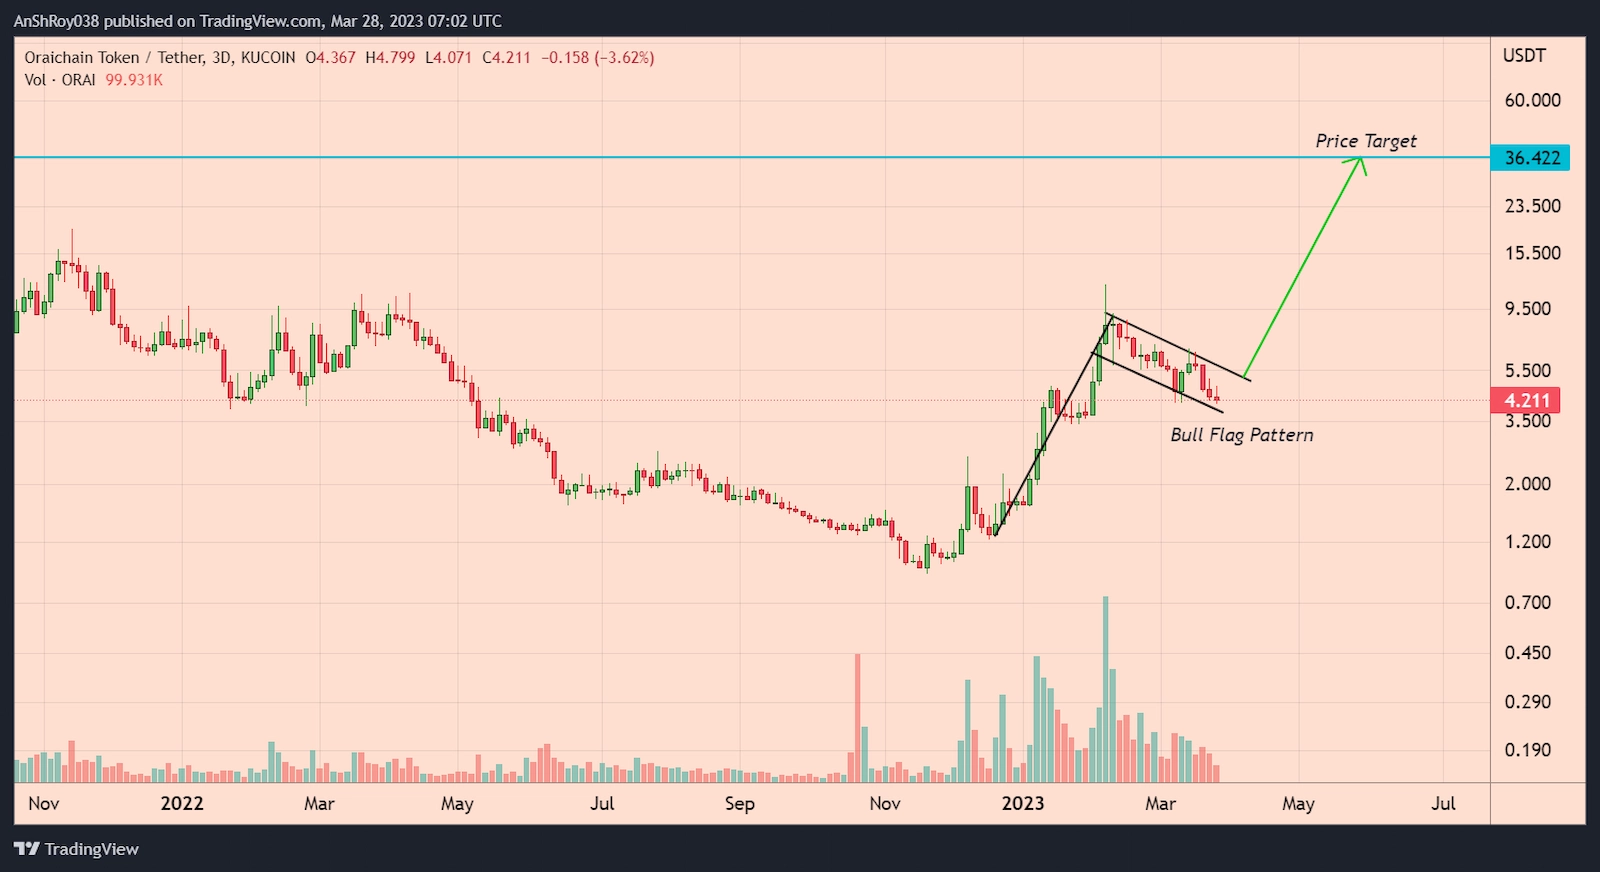
A period of consolidation succeeding the steep uptrend forms the flag of the pattern. Despite the strong vertical rally, the asset price does not drop as bulls maintain the buying pressure. As a result, the breakout from the flag pattern often results in a powerful uptrend.
Traders calculate the price target of the breakout by adding the length of the flag pole to the breakout price level. Per the rules of technical analysis, the ORAI price might rise by 766% to reach $36.4.
Death Cross Forms As Oraichain Price Sheds 33.3% In A Week
ORAI prices have been downtrend since March 18, dropping 35% weekly to a daily low of $4.1 on March 28. Furthermore, the downtrend forced ORAI’s 20-day EMA (red wave) to cross below its 50-day EMA (purple wave) and form a bearish technical pattern called the death cross on March 24.
Also Read: El Salvador’s Bitcoin (BTC) Friendly President Nayib Bukele Will Eliminate Taxes on Tech SectorTraders consider the pattern an indicator of negative market sentiment. As a result, it might increase the selling pressure for the Oraichain token price. A marketwide sell-off might force the ORAI price to drop to 200-day EMA (green wave) support near $4.
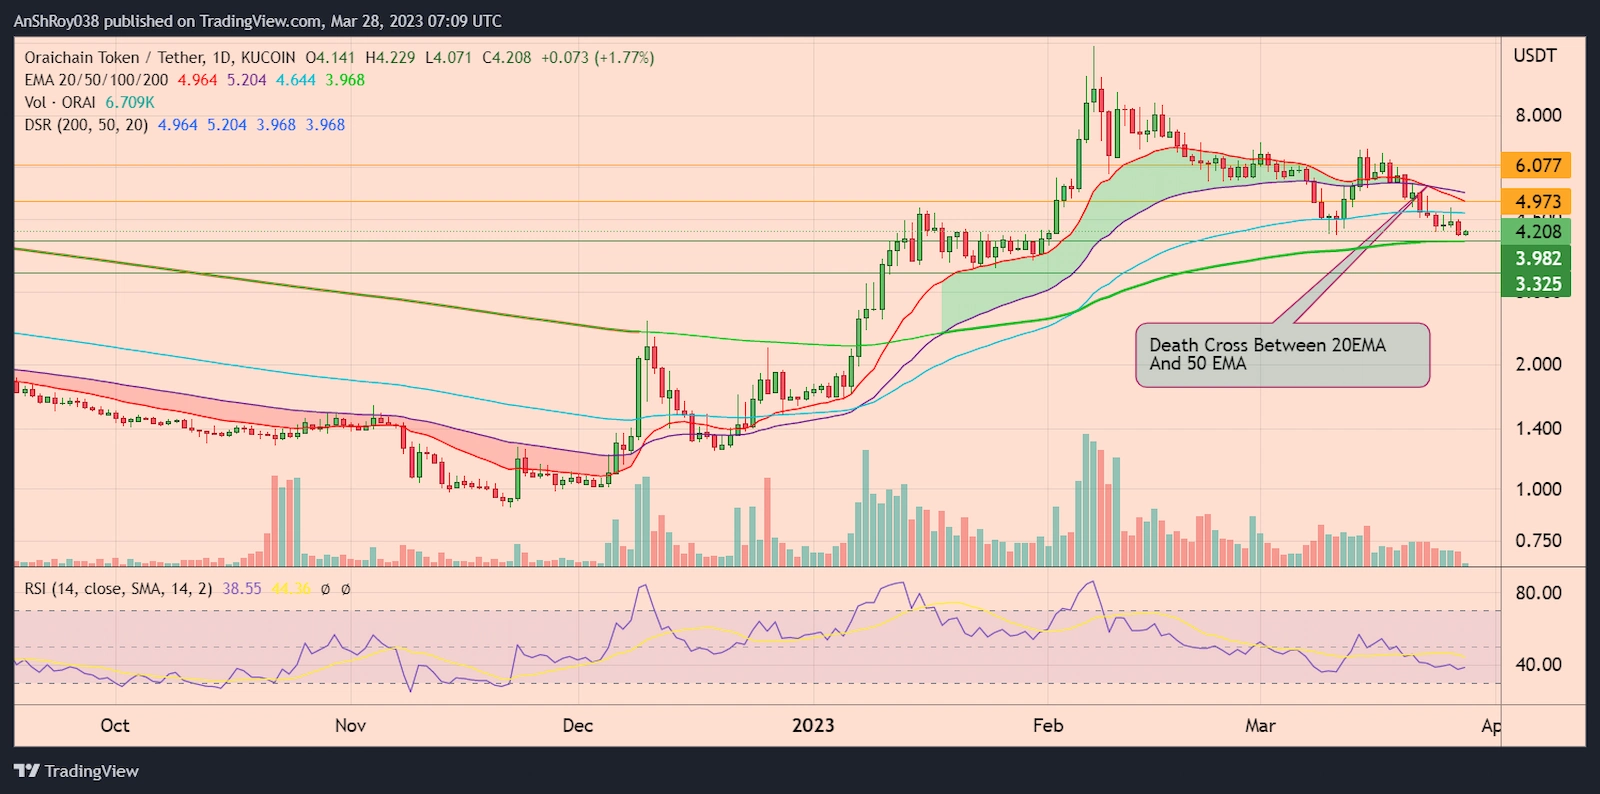
Breaching the immediate level would force the ORAI price to test support near $3.3 before recovering.
Conversely, if bulls arrest the downtrend, the recovery rally would likely see the ORAI price challenge the 20-day EMA (red wave) resistance near $5. A break and hold above immediate resistance might help the Oraichain token to reach $6.1 before retreating.
Meanwhile, the relative strength index remains neutral for the ORAI token, with a value of 38.55 on the daily charts.
4. PlatON Network Token Forms Falling Wedge Pattern
PlatON Network is an open-source, privacy-centered, Web 3.0 infrastructure protocol that uses AI technology. The platform allows individuals and businesses to act as data owners in exchange for using their computing power.
Users are becoming increasingly concerned about data protection and privacy measures. Hence, the blockchain platform might help developers improve the data security of their projects by leveraging PlatON’s infrastructure.
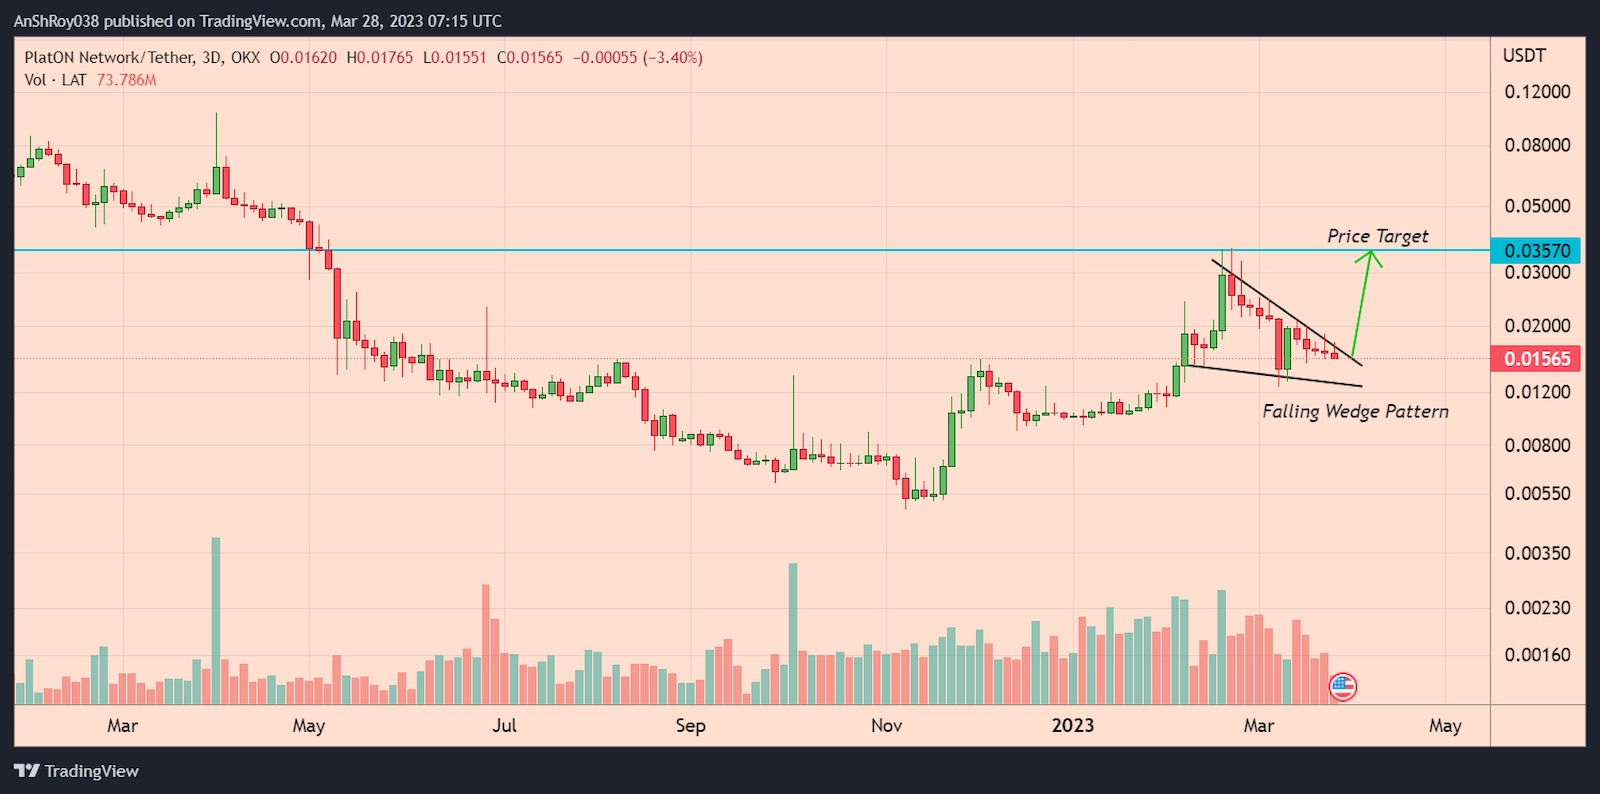
PlatON Network’s native token, LAT, formed a bullish pattern called the falling wedge. In detail, the technical pattern forms when the price fluctuates inside a pair of falling trendlines that would converge down the slope. The outcome of such downside patterns is typically a price breakout to the upside.
The upside target for the breakout is equal to the maximum distance between the falling wedge’s upper and lower trendlines. Hence, the pattern predicts a 131% rise in LAT price if the token confirms the pattern to reach $0.36.
LAT Bulls Defending Key Support
LAT price has been trending downward since Feb 21. The AI crypto token began a short-lived relief rally on March 11, but the uptrend soon fizzled out. The PlatON Network token price has been crabbing since March 15.
Also Read: Cathie Wood’s Ark Invest is Trading Coinbase Like a Day TraderHowever, long wicks on both ends of the token’s recent daily candles suggest the market remained indecisive about LAT price’s future.
A LAT price uptrend must first conquer the 200-day EMA (green wave) resistance near $0.017 to be viable. Then, breaking and consolidating above the immediate resistance would help the token challenge resistance near $0.018 before retreating.
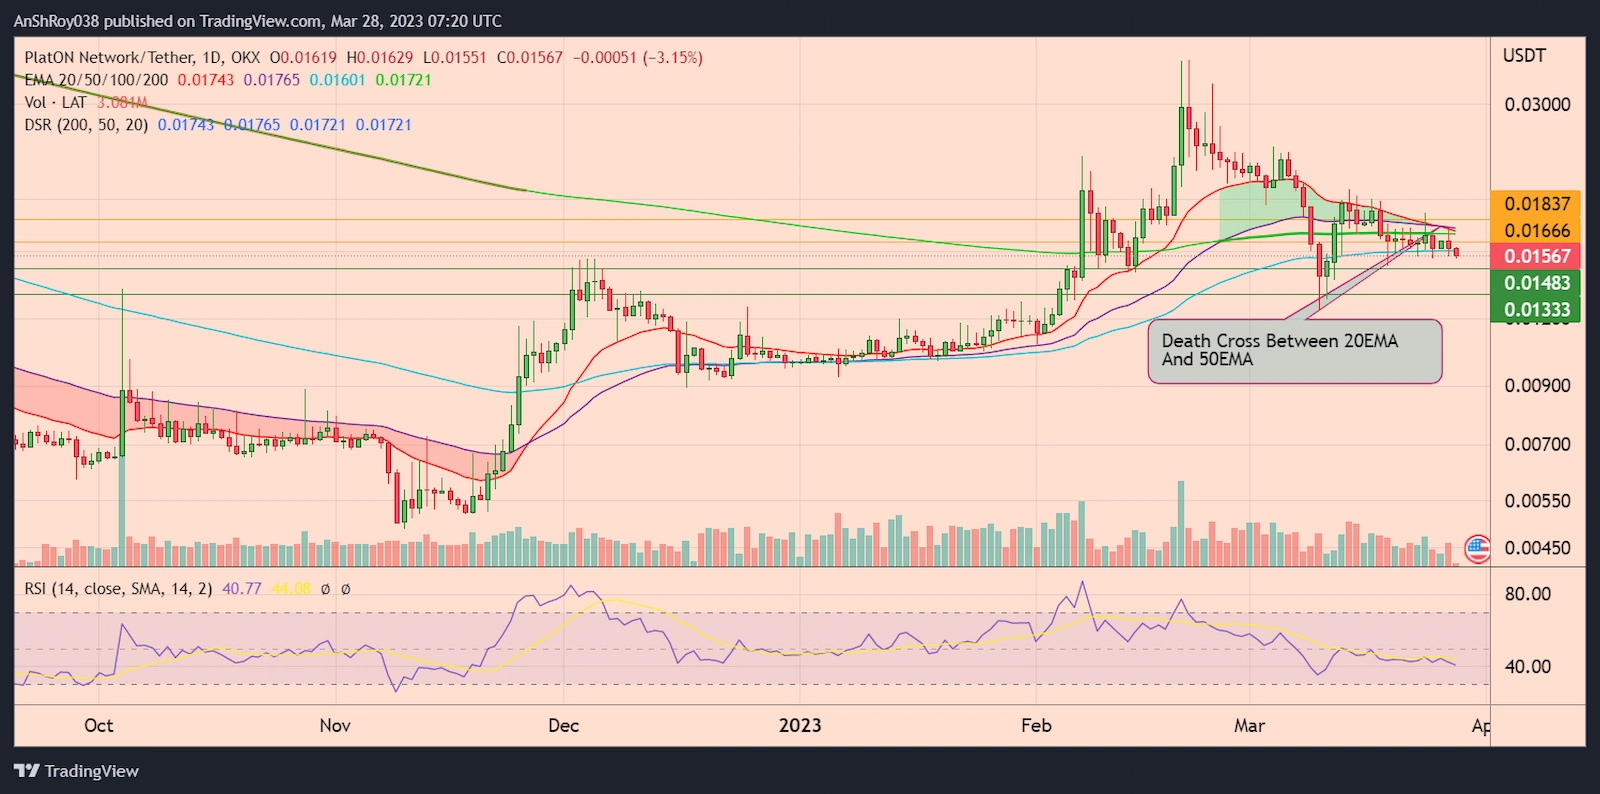
Conversely, if the bears gain control over its price action, the LAT token might fall to support near $0.015. Breaching the immediate support level might result in LAT price falling to test support near $0.013 before recovering.
The RSI for LAT remains neutral, clocking at 40.77 on the daily chart.s
5. SingularityDAO Paints Bullish Pattern
SingularityDAO is a decentralized non-custodial dynamically adjusted basket (Dynaset) of assets. The platform aims to introduce DeFi to help the sector develop and expand. However, the crypto DeFi sector has been plagued with security issues, which AI might be able to solve.
The DeFi protocol uses AI to manage portfolio allocation and efficiently allocate assets. The platform offers staking options too. Bull flags consist of a flag pole, resulting from a near-vertical rise in the crypto token’s prices.
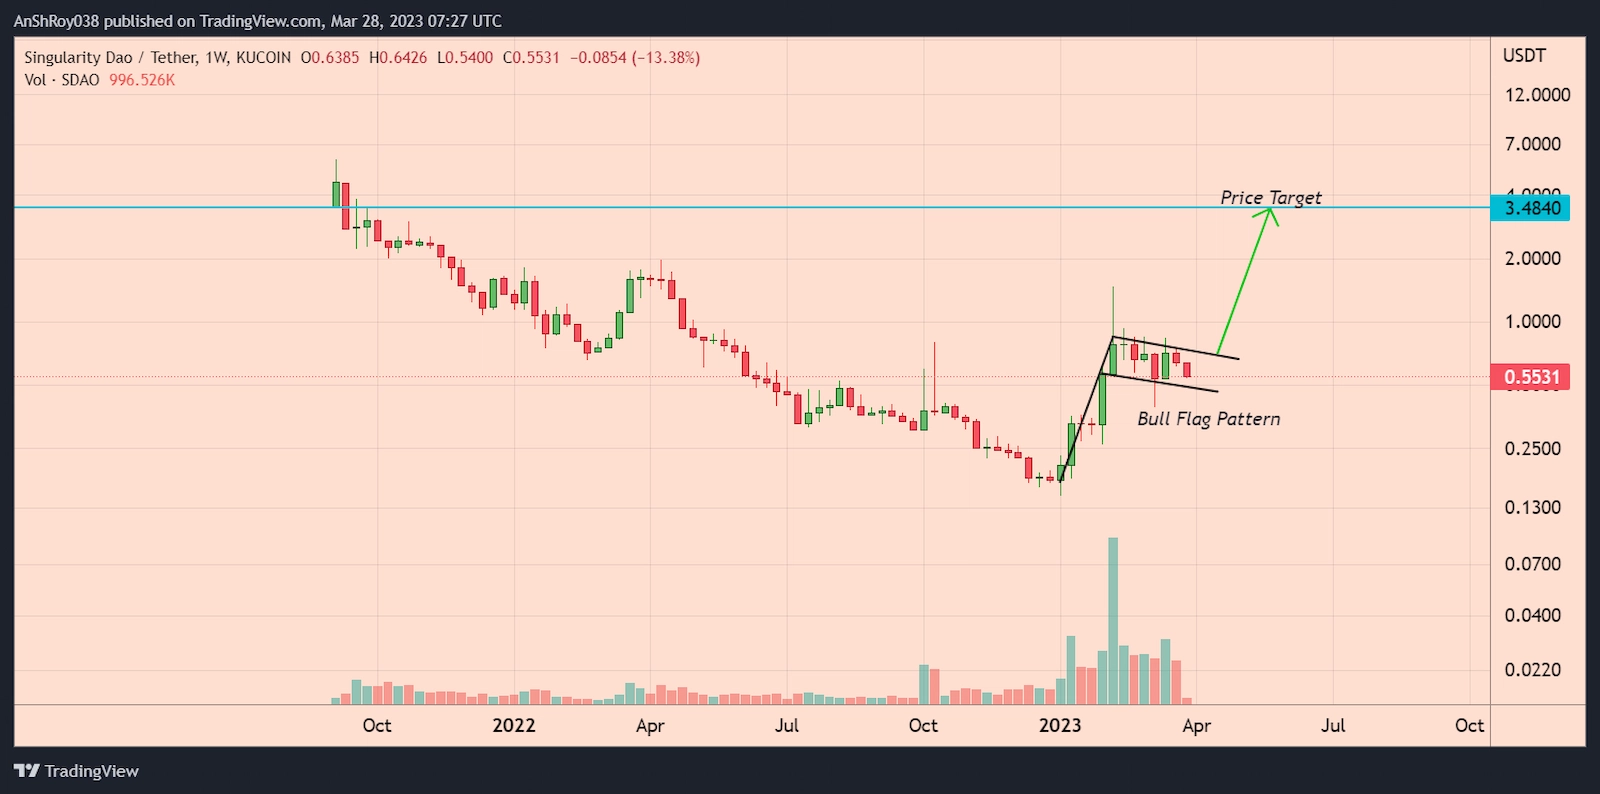
A period of consolidation succeeding the steep uptrend forms the flag of the pattern. Despite the strong vertical rally, the asset price does not drop as bulls maintain the buying pressure. As a result, the breakout from the flag pattern often results in a powerful uptrend.
Traders calculate the price target of the breakout by adding the length of the flag pole to the breakout price level, which would mean SDAO has a price target near $3.5, a rise of over 536%.
SDAO Bulls Aggressively Defending Key Support
On the daily timeframe, SDAO price action has mirrored the price action of the other crypto AI tokens. However, bearish pressure on the SingularityDAO token price seems to be increasing. SDAO price nearly dropped 14.5% since March 27 to form a daily low near $0.64 on March 28.
The SDAO bulls struggle to keep the token’s price above the 100-day EMA (blue wave). Failure to hold the EMA support could force the SingularityDAO token price to test 200-day EMA (green wave) support near $0.504.
Breaching the immediate support could result in the SDAO price dropping to support near $0.41 before recovering.
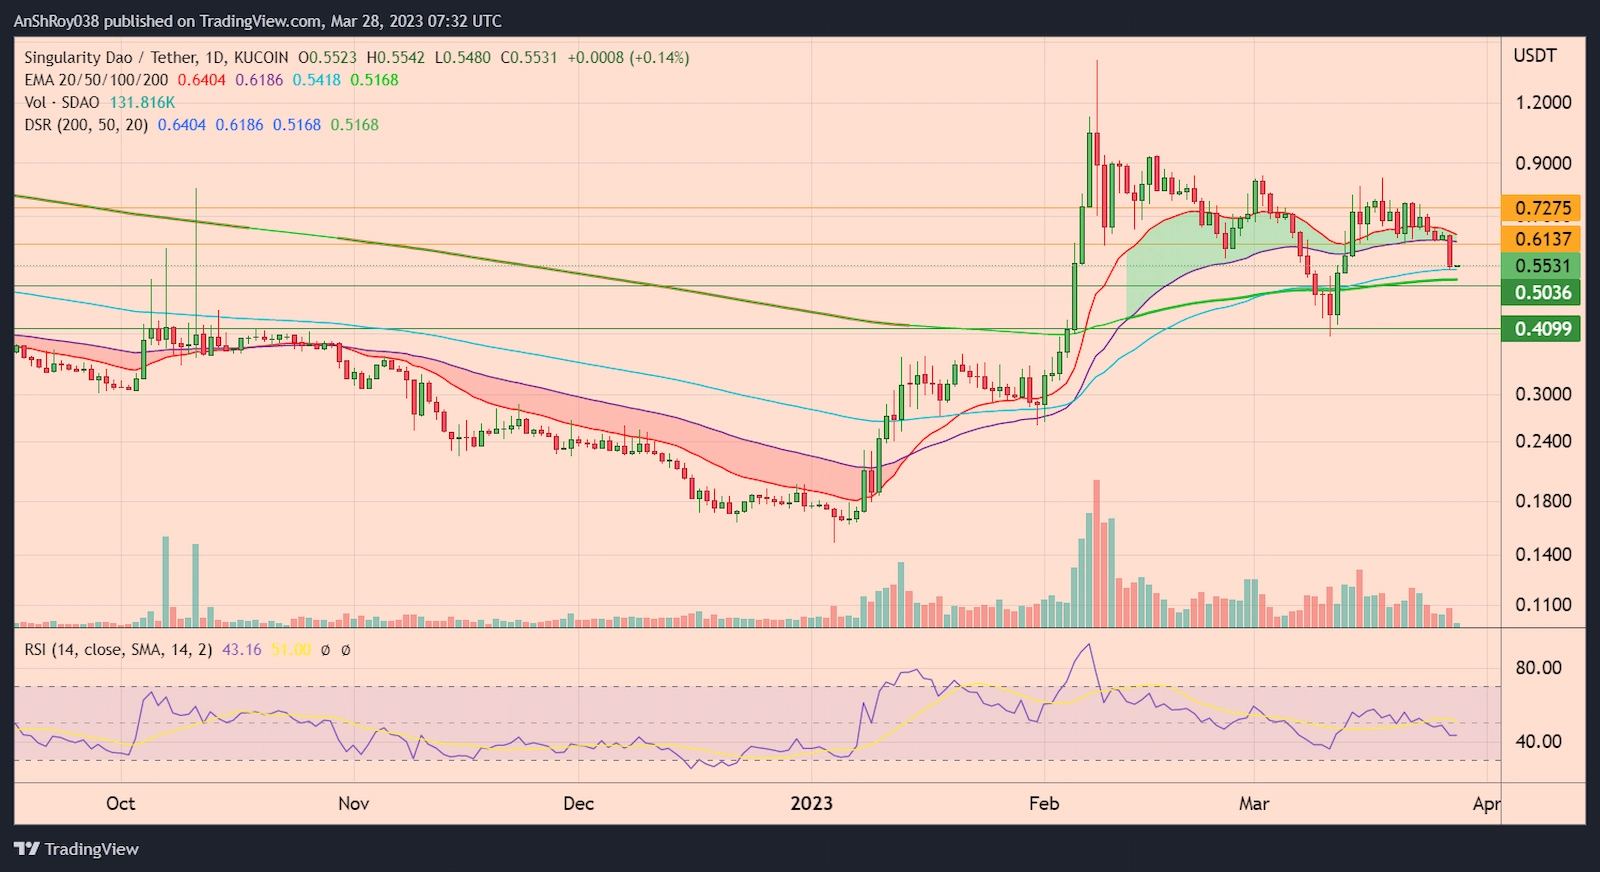
Technical indicators suggest a buy signal for the AI crypto token in the monthly time frame, signaling investor interest in the token is high.
As such, buyers entering the market might help the crypto AI token price conquer the 50-day EMA (purple wave) resistance near $0.69 before challenging the resistance near $0.86.
The relative strength index for SDAO remained neutral, clocking at 50.59 on the daily charts.
The crypto AI tokens are not reliant on speculation and hype for their adoption. Several AI-based crypto projects have made significant partnerships that could go live later in 2023, providing a boost to their native token’s price action.
As such, 2023 might see crypto AI tokens leading the bull run.

… [Trackback]
[…] Read More to that Topic: coinchapter.com/5-crypto-ai-tokens-likely-to-leverage-ai-hype-for-a-bull-run/ […]
… [Trackback]
[…] Read More on to that Topic: coinchapter.com/5-crypto-ai-tokens-likely-to-leverage-ai-hype-for-a-bull-run/ […]
… [Trackback]
[…] Find More on that Topic: coinchapter.com/5-crypto-ai-tokens-likely-to-leverage-ai-hype-for-a-bull-run/ […]