


NEW DELHI (CoinChapter.com) — Holochain (HOT) prices broke below a bearish technical pattern called descending triangle pattern.
In detail, a descending trendline connecting swing highs and a horizontal trendline joining swing lows form the pattern. The height of the triangle’s thickest section determines the price target in a descending triangle setup.
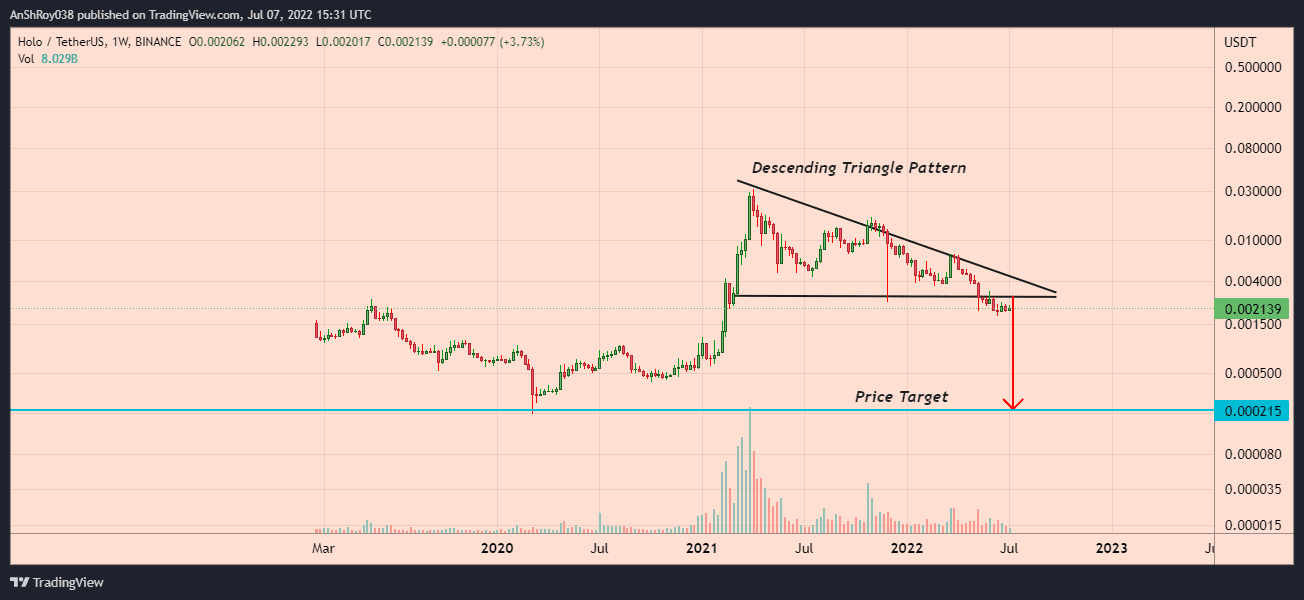
The pattern gives HOT prices a breakdown target nearly 90% below its current price levels at $0.00214 to reach near $0.00022.
Also Read: Holochain rally loses steam after HOT jumps 28% in four days.However, the altcoin’s prices have been moving laterally since the breakout, with the volume declining. Hence, it might be possible Holo prices might return inside the pattern, indicating a fakeout.
HOT’s RSI Charting Bullish Divergence
HOT prices jumped more than 10% on Jul 7 between intraday low ($0.0021) and high ($0.0023). Moreover, Holo has been trading below a descending trendline resistance since May 5 this year.
Holo’s relative strength index is currently neutral, with a value of 46.23 on the daily charts. The RSI measures the magnitude of recent price changes to analyze overbought or oversold conditions. Moreover, RSI has formed a bullish divergence with its price action.
In detail, a bullish divergence occurs when the RSI becomes oversold followed by a higher low, while the cryptocurrency’s prices form lower lows. It indicates rising bullish momentum.
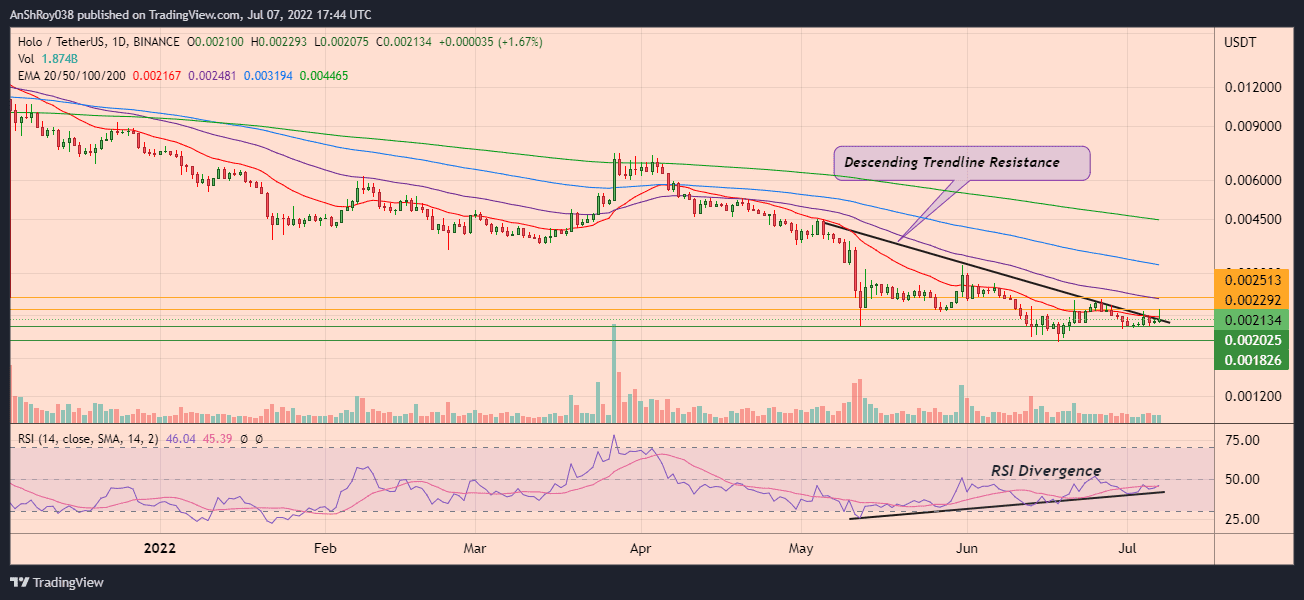
However, HOT prices would need to move above their 20-day exponential moving average (20-day EMA, red wave) to challenge resistance near $0.0023, which has rebuffed HOT price action since Jun 26.
Also Read: Uniswap (UNI) valuation could swell by nearly 110% — here’s why.A move above the 20-day EMA would see Holochain prices cross above the multi-week descending trendline resistance, providing Holo prices the impetus to target resistance from their 50-day EMA (purple wave) near $0.0025.
On the hand, if HOT prices fail to register an uptrend, the token would likely fall to support near $0.00203, which has supported Holo price action since Jun 21. A breach below immediate support could result in HOT prices testing support near $0.00183.
At writing, HOT was trading at $0.00214, up 2.1% on the day.



… [Trackback]
[…] Read More Info here to that Topic: coinchapter.com/holochain-triangle-setup-forecasts-90-fall-for-hot-prices/ […]
… [Trackback]
[…] Read More on on that Topic: coinchapter.com/holochain-triangle-setup-forecasts-90-fall-for-hot-prices/ […]
… [Trackback]
[…] Read More on that Topic: coinchapter.com/holochain-triangle-setup-forecasts-90-fall-for-hot-prices/ […]
… [Trackback]
[…] Find More Info here on that Topic: coinchapter.com/holochain-triangle-setup-forecasts-90-fall-for-hot-prices/ […]
… [Trackback]
[…] Here you will find 43555 more Information to that Topic: coinchapter.com/holochain-triangle-setup-forecasts-90-fall-for-hot-prices/ […]
… [Trackback]
[…] There you can find 66275 more Information on that Topic: coinchapter.com/holochain-triangle-setup-forecasts-90-fall-for-hot-prices/ […]
… [Trackback]
[…] Info to that Topic: coinchapter.com/holochain-triangle-setup-forecasts-90-fall-for-hot-prices/ […]
… [Trackback]
[…] Find More Info here on that Topic: coinchapter.com/holochain-triangle-setup-forecasts-90-fall-for-hot-prices/ […]
… [Trackback]
[…] Find More here to that Topic: coinchapter.com/holochain-triangle-setup-forecasts-90-fall-for-hot-prices/ […]
… [Trackback]
[…] Find More Information here to that Topic: coinchapter.com/holochain-triangle-setup-forecasts-90-fall-for-hot-prices/ […]