
NEW DELHI (CoinChapter.com) — Peer-to-peer blockchain platform Holochain’s native token HOT soared up in the week beginning Mar 21. The platform serves as a bridge between the broader internet and apps built using Holochain.
The Holochain token’s recent bull run helped HOT break above a three-month-long descending trendline resistance. HOT prices moved from Mar 21’s low of $0.0043 to reach the week’s high of $0.00547, jumping 28.3% before corrections pared gains.
Bears are likely booking profits as the Holochain token lost nearly 5.2% on Friday. However, the token started the weekend positively, indicating bulls are not giving up.
In addition, HOT’s 20-day exponential moving average (red wave) seems to be moving up towards its 50-day EMA (yellow wave) and will likely form a bullish chart pattern called a Golden cross. Trades often consider the pattern a precursor to an upcoming bull run.
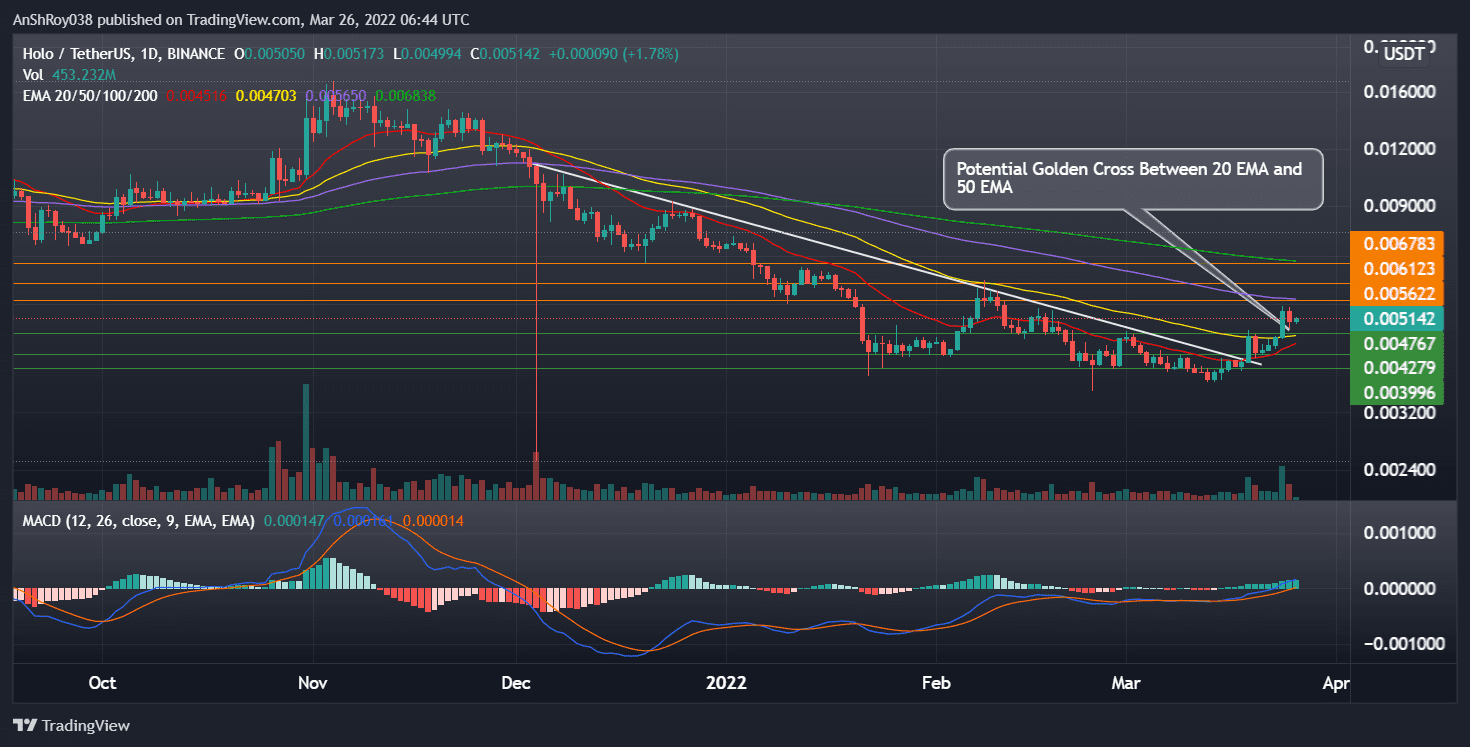
Ironically, HOT prices would need to keep moving upwards for the pattern to complete. A continued rally would bring the Holochain token towards immediate resistance from its 100-day EMA (purple wave) near $0.00562.
Also Read: Holochain eyes further decline on bearish triangle setup as HOT drops 12% in a week.If HOT flips 100-day EMA resistance, the token would likely target resistance near $0.00612 before moving to challenge resistance from its 200-day EMA (green wave) near $0.0068.
Trend-based momentum oscillator MACD continues to forecast bullish signals for the Holochain token. The MACD signal line, a difference between 12-day and 26-day EMA, seems to be moving away from the MACD signal line (9-day EMA of MACD), resulting in expanding bars on the MACD histogram.
Expanding bars on the MACD histogram indicate strengthening bullish momentum for HOT.ch
Holochain Bulls Relying On RSI
Meanwhile, Holochain traders seem to be relying on its relative strength index for buy and sell signals. Over the past two weeks, whenever HOT’s RSI has made a significant move upwards on its daily charts, it has been followed by a correction.
For example, on Mar 19, the Holochain token gained 14.35%, with its RSI going nearly vertical to reach 59.64. Although still neutral, HOT prices pulled back on Mar 20 before starting their current bull run.
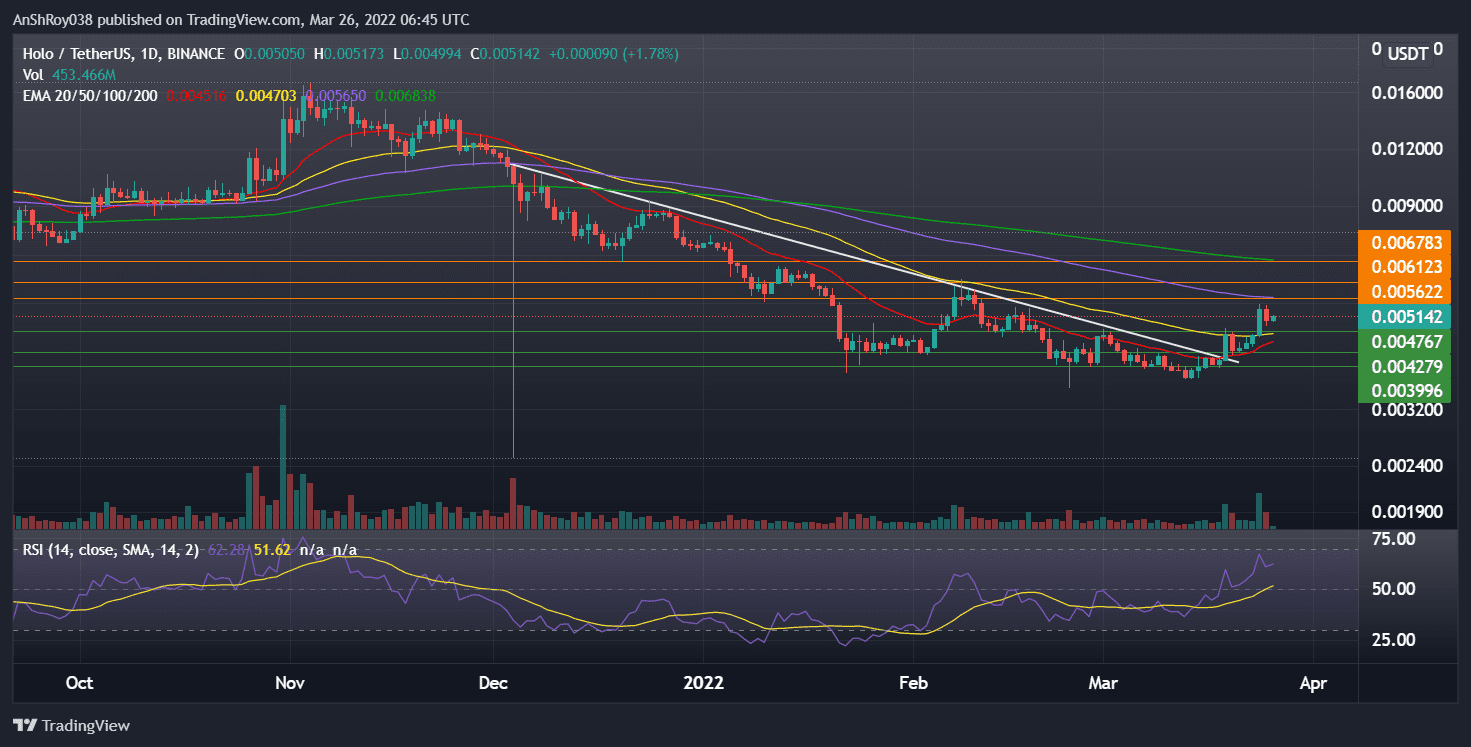
Similarly, as the recent upside rally brought RSI to 67.29 on Mar 24, prices once again pulled back on Friday. HOT’s RSI is currently neutral, clocking 62.28 on the daily charts. To recap, traders often consider an overbought RSI a sell signal, as a trend reversal usually follows the RSI going above 70.
Also Read: Holochain token (HOT) holds on to a rebound level amid fundamental growth.As such, if the Holochain token fails to keep moving upwards, HOT prices could test support from its 50-day EMA (yellow wave) near $0.00477. Further downtrend could see prices break below immediate support to reach $0.00428.
Finally, HOT has support at $0.004, near its descending trendline.
At the time of writing, HOT was trading at $0.00516, up 2.2% on the day.

… [Trackback]
[…] Info on that Topic: coinchapter.com/holochain-rally-loses-steam-after-hot-jumps-28-in-four-days/ […]
… [Trackback]
[…] Read More Information here to that Topic: coinchapter.com/holochain-rally-loses-steam-after-hot-jumps-28-in-four-days/ […]
… [Trackback]
[…] Find More on that Topic: coinchapter.com/holochain-rally-loses-steam-after-hot-jumps-28-in-four-days/ […]
… [Trackback]
[…] Find More Info here on that Topic: coinchapter.com/holochain-rally-loses-steam-after-hot-jumps-28-in-four-days/ […]
… [Trackback]
[…] Information to that Topic: coinchapter.com/holochain-rally-loses-steam-after-hot-jumps-28-in-four-days/ […]