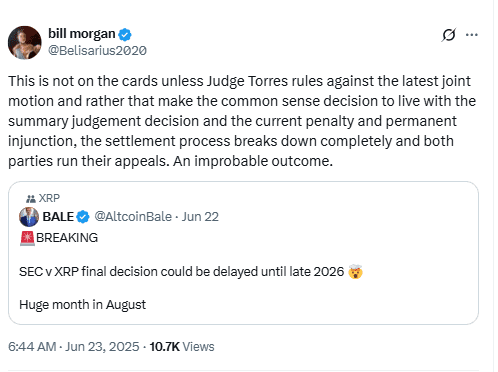
Rumors about the Ripple v. SEC case lasting until 2026 spread across X this weekend. A post from pseudonymous trader “Altcoin Bale” claimed the final decision might be delayed until late 2026. His claim quickly gained traction on crypto-focused feeds.
Veteran XRP legal analyst and Australian solicitor Bill Morgan dismissed the rumor. He said the delay is highly unlikely unless two rare outcomes occur: Judge Analisa Torres denies the latest joint motion, and both Ripple and the SEC proceed with full appeals. “An improbable outcome,” Morgan wrote on X.
Ripple and the SEC filed a joint motion on June 13 under Rule 60(b)/62.1. The motion asks Judge Torres to dissolve the August 2024 injunction and allow the redistribution of the $125 million penalty in escrow. The SEC would receive $50 million. Ripple would get back $75 million.
If Torres agrees, both parties plan to request a limited remand from the Second Circuit. That would let the district court issue a revised final judgment and close the case without appeals.
The Second Circuit has already paused the appeals process. It simply asked the SEC to file a status update by August 15, 2025. Morgan clarified that this date is being misinterpreted as a litigation deadline, but it only concerns administrative progress.
Previous Decisions Set the Stage for Closure
In July 2023, Torres ruled that institutional XRP sales violated securities laws but programmatic sales on exchanges did not. In August 2024, she issued a $125 million penalty and a permanent injunction. The SEC later dropped its appeal against the programmatic-sales ruling, signaling a shift in its crypto enforcement approach.
Following that, Ripple and the SEC began settlement talks. Their updated June motion aims to correct procedural errors in a previous filing rejected in May.
Morgan acknowledged that if Torres denies the joint request and the injunction remains, both parties might revive their cross-appeals. That scenario could delay final resolution until late 2026. But he called that path improbable, given the current cooperation and the SEC’s retreat from a hardline crypto stance.
XRP Forms Falling Wedge on Daily Chart, Signals Possible 21% Breakdown Risk
On June 24, 2025, XRP formed a falling wedge pattern on the 1-day chart against the U.S. dollar (USD), published on TradingView. A falling wedge pattern shows two downward-sloping trendlines that narrow over time and is typically a bullish reversal signal, though it can also break down in some cases.
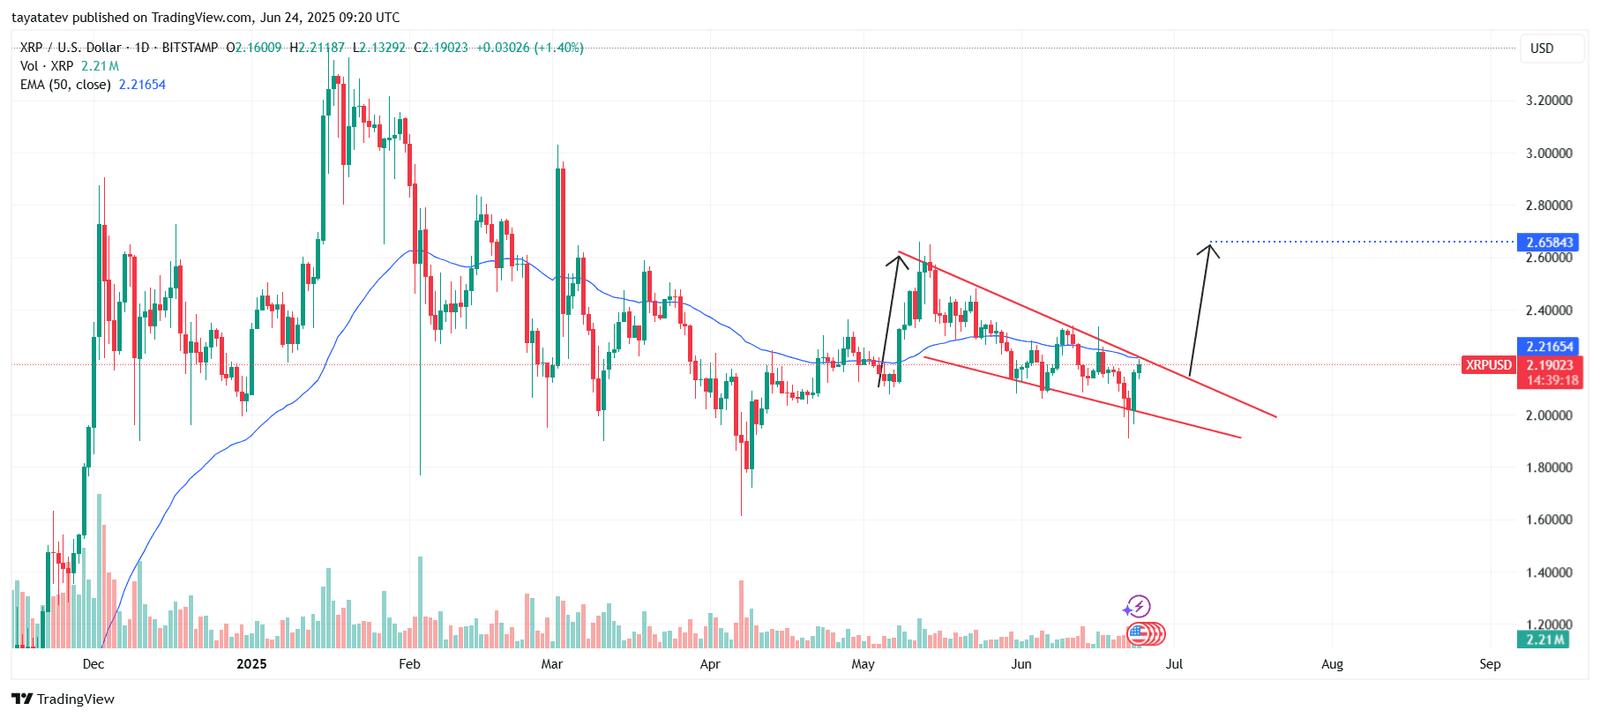
In this setup, the price trades below the 50-day Exponential Moving Average (EMA), which sits at $2.21654. The current price is $2.19023. If XRP fails to break above the wedge resistance and instead closes below the lower support trendline, the bearish scenario may activate.
In that case, XRP could drop roughly 21% from the current price, which would push the token down to around $1.73. The wedge shows tightening price action and decreasing volume, increasing the risk of a sharp move in either direction.
Still, if bulls regain control and XRP breaks above the wedge resistance, a move toward the $2.65 target remains possible. For now, the pattern remains valid, and both breakout and breakdown options are open depending on the next few daily closes.
XRP MACD Turns Bearish Again on June 24, 2025
Meanwhile, the Moving Average Convergence Divergence (MACD) indicator on the 1-day XRP/USD chart showed a bearish crossover. The MACD line (blue) crossed below the signal line (orange), both hovering around –0.034.
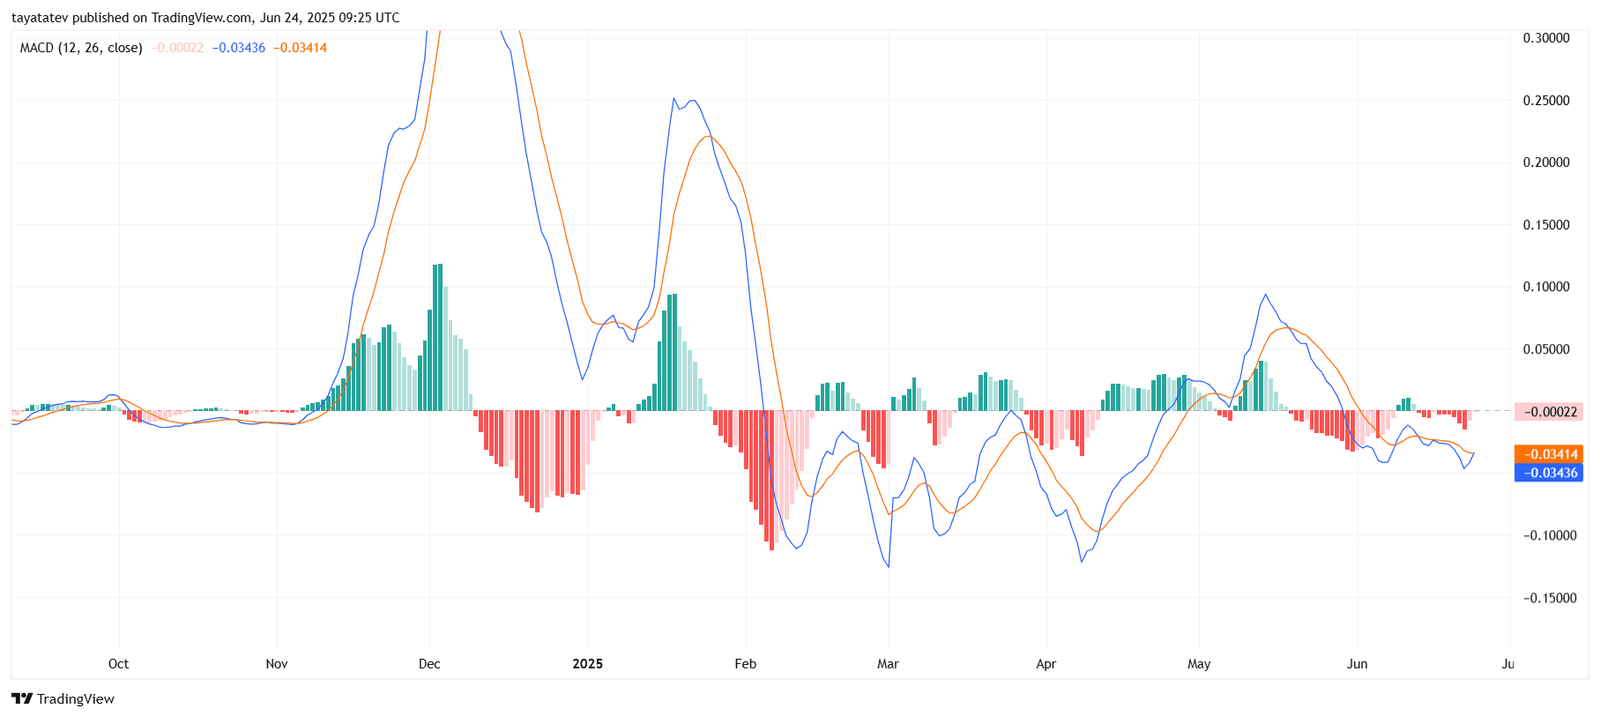
The MACD is a momentum indicator that compares two Exponential Moving Averages (usually 12- and 26-period). When the MACD line moves below the signal line, it signals weakening upward momentum and potential for further downside.
Moreover, the histogram bars turned red again and remained below zero, confirming ongoing selling pressure. This bearish signal supports the falling wedge breakdown scenario seen on the price chart and may add weight to the potential 21% decline if price breaks below wedge support.
XRP RSI Shows Weak Recovery on June 24, 2025
The Relative Strength Index (RSI) for XRP/USD on the 1-day chart stood at 51.30, just slightly above the neutral 50 level. RSI is a momentum oscillator that measures the speed and change of price movements. It ranges from 0 to 100, with values above 70 indicating overbought conditions and below 30 indicating oversold.
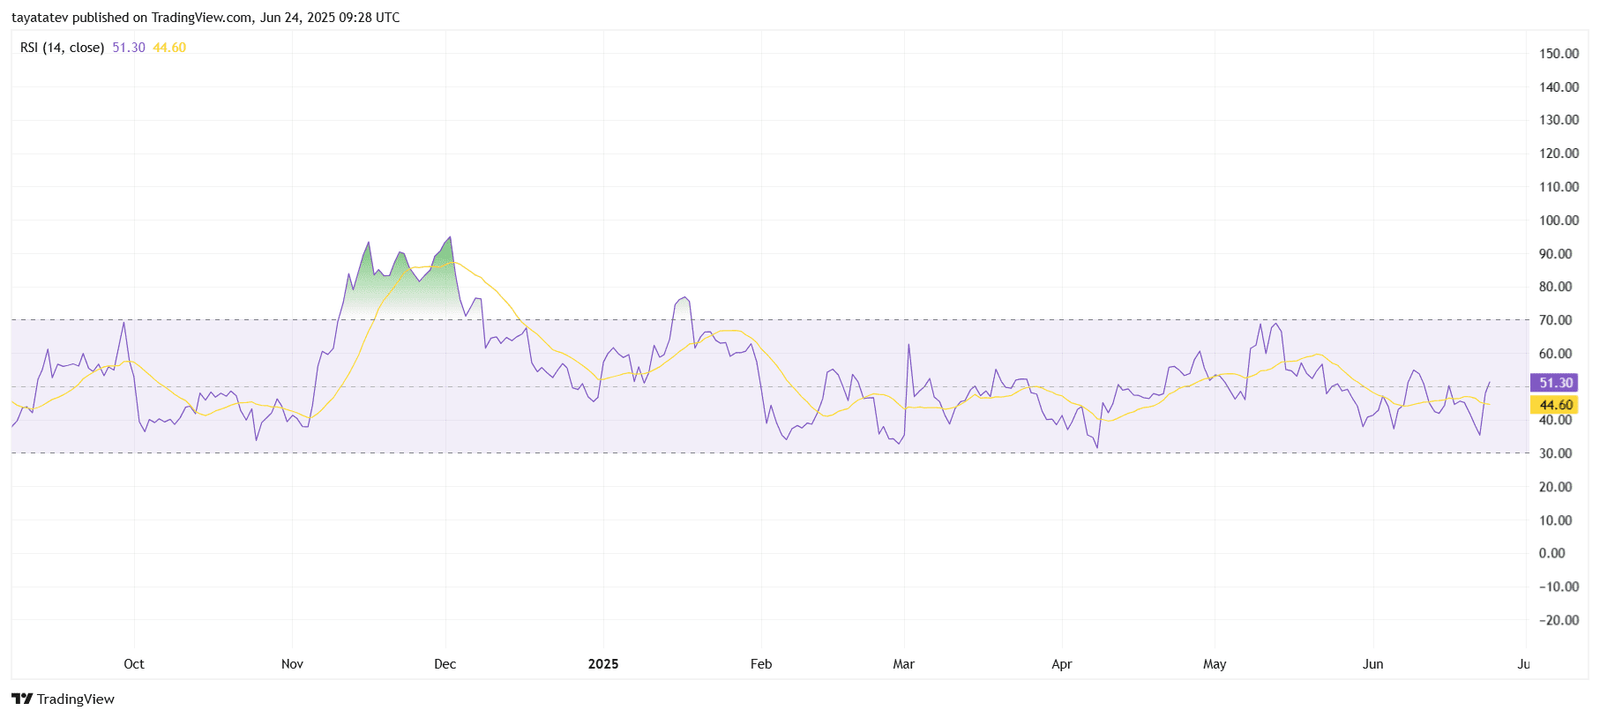
Despite the RSI crossing above its moving average (currently at 44.60), the recovery remains weak. This modest uptick suggests indecision rather than a clear bullish reversal.
Although RSI above 50 usually supports upward momentum, XRP’s RSI lacks strength to confirm any breakout, especially with no sharp surge above 60. If it drops back below the moving average, bearish pressure may increase again, supporting the potential falling wedge breakdown.
XRP Balance of Power Turns Positive on June 24, 2025
The Balance of Power (BoP) indicator forXRP/USD printed 0.52, signaling short-term buyer strength. The BoP measures the strength of buyers versus sellers during a given trading period. A positive value means buyers dominate, while a negative value shows sellers are in control.
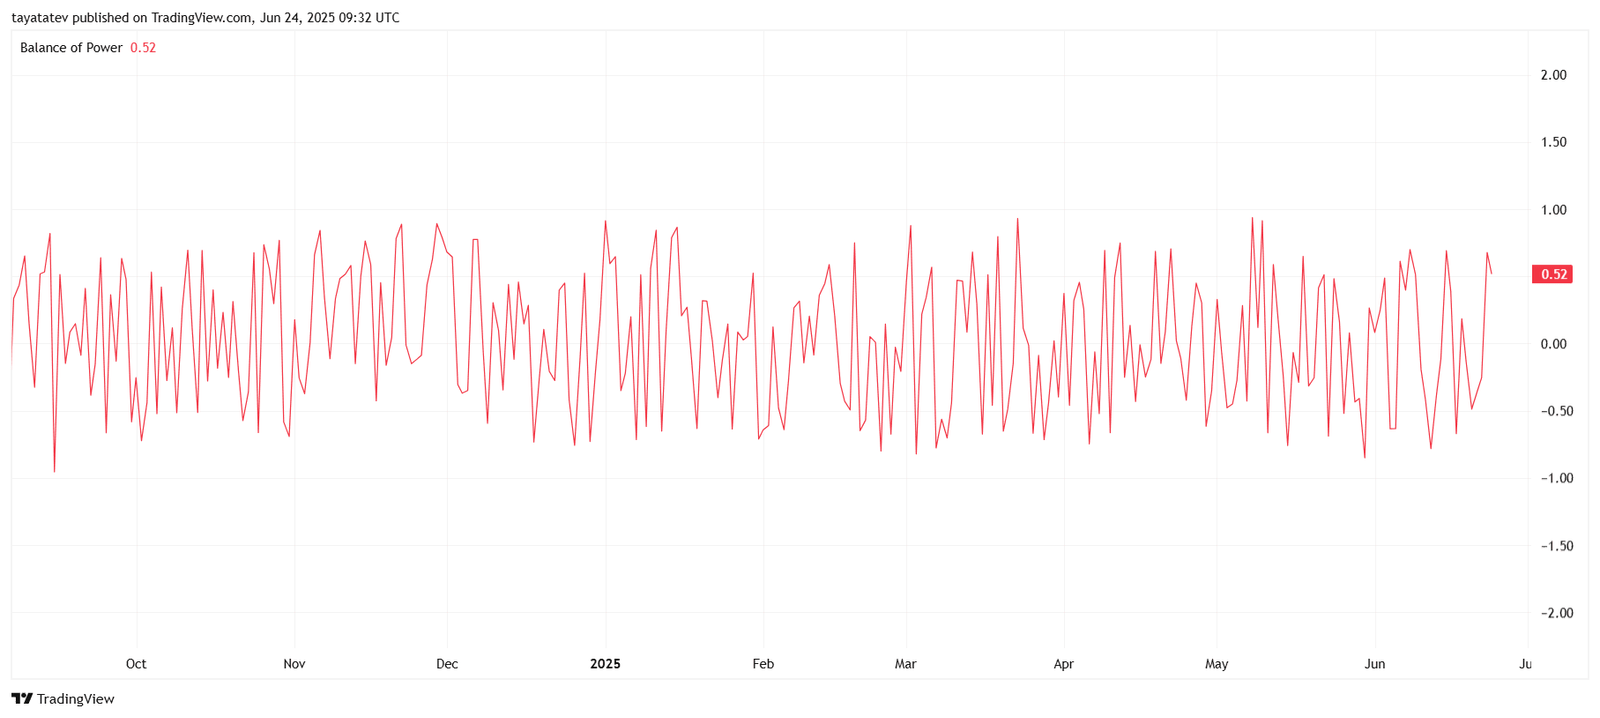
After weeks of mixed signals and fast swings around zero, this current upward spike above 0.50 suggests bulls are gaining slight control. However, the BoP remains highly volatile, reflecting indecision in broader trend direction.
While this positive value may support a short-term bounce, it remains insufficient alone to confirm a bullish reversal. Other indicators like the MACD and falling wedge still hint at possible downside.
