
Key Takeaways:
- STEEM, the native token of Steem blockchain’s Steemit dApp, registered a massive 45% rally on Jan 10 before prices corrected.
NEW DELHI (CoinChapter.com) — STEEM price started the week with a massive 44.70% rally on Dec 10 before prices fell prey to profit-taking.
The community-focused blockchain token began trading at $0.389 before rising to an intraday high of $0.535. However, later trading sessions saw rising selling pressure, leading to prices pulling back. The nearly five weeks old immediate resistance near $0.50 continues to rebuff the Steem token’s price action.
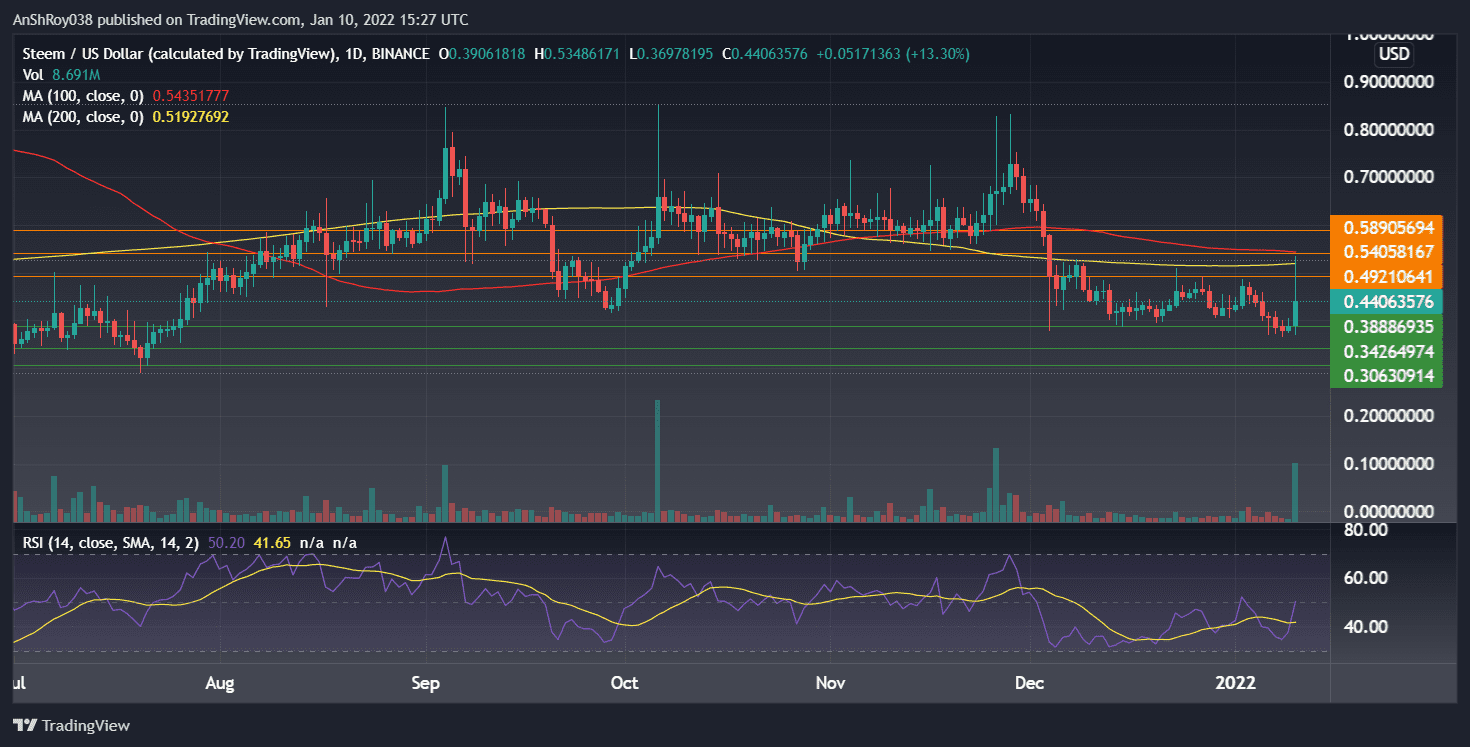
The STEEM price’s immediate resistance came to be near its 50-day moving average (MA). Moreover, a further upside movement could bring the token to challenge resistance near its 100-day MA trendline at $0.54. If it garners some bullish fundamentals, the price may rise to $0.59 before receding.
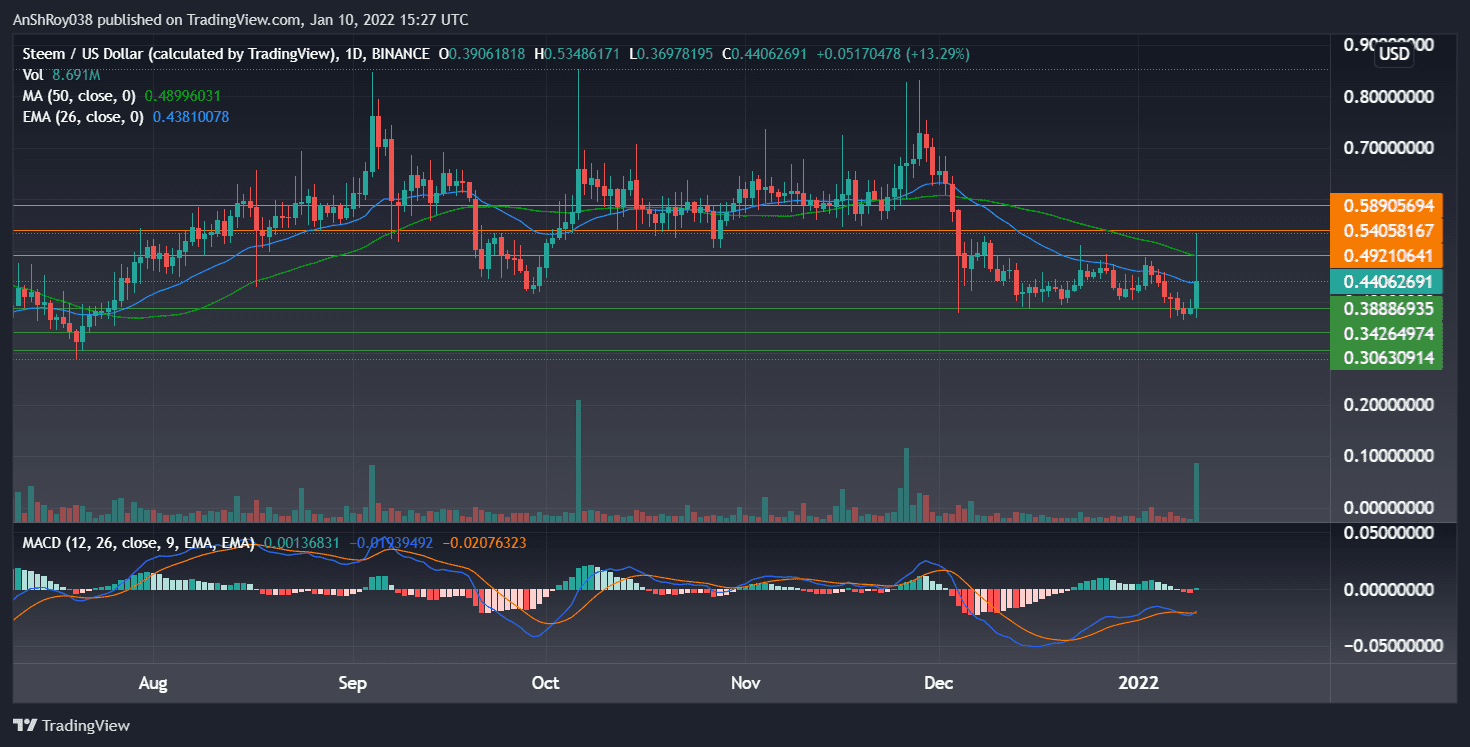
On the other hand, if traders continue their selling spree, prices could fall to immediate support near $0.39. The $0.39 price level has been supporting the STEEM price since Dec 4. Sustained selling pressure could push prices down to $0.34, a price level, last seen in late July.
Also Read: Chainlink ducks crypto market downtrend as LINK rises 36% in 2022—but is this rally sustainable?Weak STEEM price upside momentum
Meanwhile, momentum oscillator MACD charted a bullish crossover for the STEEM price two days after its momentum entered bearish regions. A bullish crossover occurs when the MACD line (difference between 12-day and 26-day EMA) moves above the MACD signal line (9-day EMA of MACD).
However, the MACD histogram bars, which plot the difference between the MACD line and its signal line, are barely above zero. As such, the bullish momentum is still weak.
The relative strength index for the STEEM price was neutral at press time, clocking near 50 on the daily charts. As such, the cryptocurrency may continue its current rally before it reaches near the overbought levels.
Steem is a community-centered blockchain designed to provide customers an earning opportunity based on their value to their network. Steemit is a blogging and social media website built on the Steem blockchain that rewards STEEM tokens to its users.
At the time of writing, the STEEM price was trading at $0.433, up 11.46% on the day.

… [Trackback]
[…] There you can find 24090 more Info on that Topic: coinchapter.com/social-blockchain-token-steem-price-jumps-nearly-45-in-a-day-but-downside-risks-persist/ […]
… [Trackback]
[…] There you will find 31856 more Information on that Topic: coinchapter.com/social-blockchain-token-steem-price-jumps-nearly-45-in-a-day-but-downside-risks-persist/ […]
… [Trackback]
[…] Info to that Topic: coinchapter.com/social-blockchain-token-steem-price-jumps-nearly-45-in-a-day-but-downside-risks-persist/ […]
… [Trackback]
[…] Find More on to that Topic: coinchapter.com/social-blockchain-token-steem-price-jumps-nearly-45-in-a-day-but-downside-risks-persist/ […]
… [Trackback]
[…] Find More Information here to that Topic: coinchapter.com/social-blockchain-token-steem-price-jumps-nearly-45-in-a-day-but-downside-risks-persist/ […]
… [Trackback]
[…] Read More Information here to that Topic: coinchapter.com/social-blockchain-token-steem-price-jumps-nearly-45-in-a-day-but-downside-risks-persist/ […]