
On July 1, 2025, Oblong, Inc. (NASDAQ: OBLG) announced it bought 5,025 TAO tokens for $1.65 million. The company used proceeds from its $7.5 million financing round to make the purchase. Each token was bought at an average price of $328.38. The firm has now staked all of the acquired tokens in the Bittensor network.
The move marks Oblong’s first direct investment in decentralized artificial intelligence. It follows the company’s June 6 announcement to shift focus toward blockchain-based AI. Bittensor is a decentralized platform used to develop and train machine learning models.
CEO Links Investment to Bittensor’s Global AI Model
Oblong CEO Peter Holst said the investment shows the company’s commitment to decentralized AI. He pointed to Bittensor’s model, which enables global participation in machine learning development.
According to the announcement, Oblong may continue to acquire more TAO tokens. The company said it will assess additional purchases weekly. It is also exploring potential partnerships in the Bittensor ecosystem to create new technology products.
Oblong plans to include staking results and token holdings in its Q2 2025 earnings report. It will also present updates at upcoming investor conferences.
Oblong Shifts Strategy Amid Falling Revenue
Previously, Oblong focused on video collaboration tools, including its Mezzanine product line. It now aims to build a cryptocurrency treasury based on decentralized AI. The company said it will keep operating its legacy business while expanding its new AI strategy.
Financial records show Oblong’s revenue dropped 30% over the past year. The company ended 2024 with $5 million in cash and no debt. It also launched a stock buyback program authorizing up to $500,000 in share repurchases, funded from its current cash reserves.
Oblong is also targeting acquisitions of SaaS companies and businesses that use AI-based automation. CEO Peter Holst said the company’s 25 years of experience in scaling tech firms will help guide this transition.
TAO Forms Bullish Flag Pattern on July 1, 2025
On July 1, 2025, Bittensor (TAO/USDT) formed a bullish flag pattern on the daily chart. The price had previously surged from mid-April to early May, creating a steep upward leg known as the flagpole. After this move, TAO entered a downward-sloping consolidation phase marked by two parallel red trendlines, which shaped the flag.
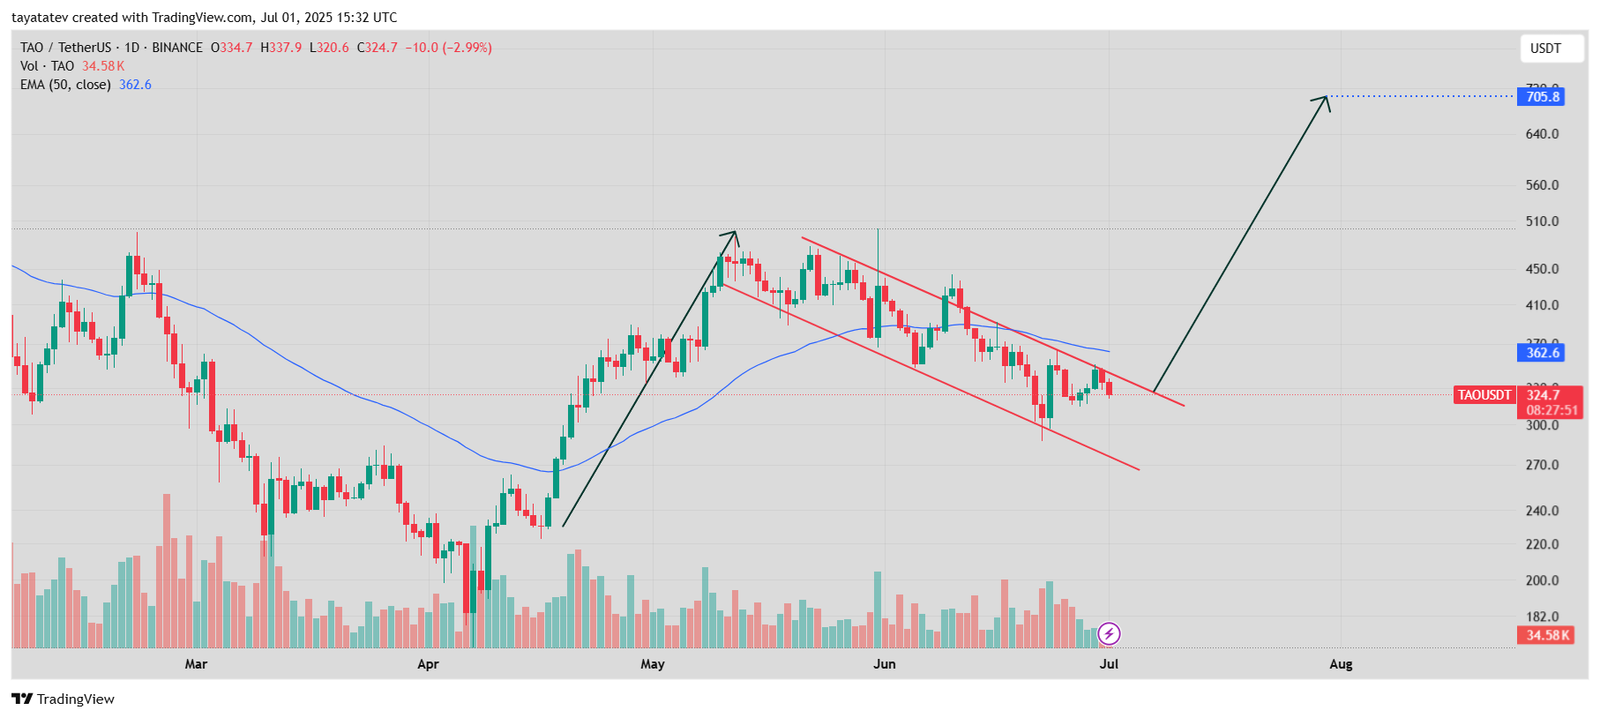
A bullish flag pattern is a continuation setup that appears after a strong upward move. It typically signals a short-term pause before the price breaks out and continues rising in the direction of the prior trend.
In TAO’s case, the flag began forming in early May and extended into July, suggesting a possible breakout soon. The price currently trades at $324.7, below the 50-day Exponential Moving Average (EMA), which sits at $362.6. However, the price is pressing against the upper boundary of the flag, indicating rising momentum.
If the breakout confirms, the pattern implies a potential move of about 118% from the current price. This target is calculated by projecting the height of the flagpole—roughly $380—upward from the breakout point around $324.7. The projected upside target lands near $705.8.
Volume analysis supports the bullish case. During the initial surge, trading volume spiked. As TAO entered the flag phase, volume declined, which aligns with a healthy consolidation. Now, volume has started to pick up slightly, hinting that traders may be preparing for a breakout.
The chart also shows that TAO has tested the lower channel boundary several times without breaking down, which signals strong demand at lower levels. Meanwhile, the price continues to make higher lows within the flag.
A breakout above the flag’s resistance and the 50-day EMA around $362.6 would validate the bullish flag pattern. If confirmed, this move could set TAO on a path toward the $700 range in the coming weeks.
In summary, TAO has established a bullish flag as of July 1. The price action, combined with volume behavior and trend structure, suggests a possible breakout and continuation toward higher levels.
TAO RSI Reading Shows Neutral Momentum on July 1
The Relative Strength Index (RSI) for Bittensor (TAO/USDT) stood at 42.19 on the daily chart. The RSI is a momentum indicator that measures the speed and change of price movements. It ranges from 0 to 100. Readings below 30 typically suggest oversold conditions, while values above 70 indicate overbought levels.
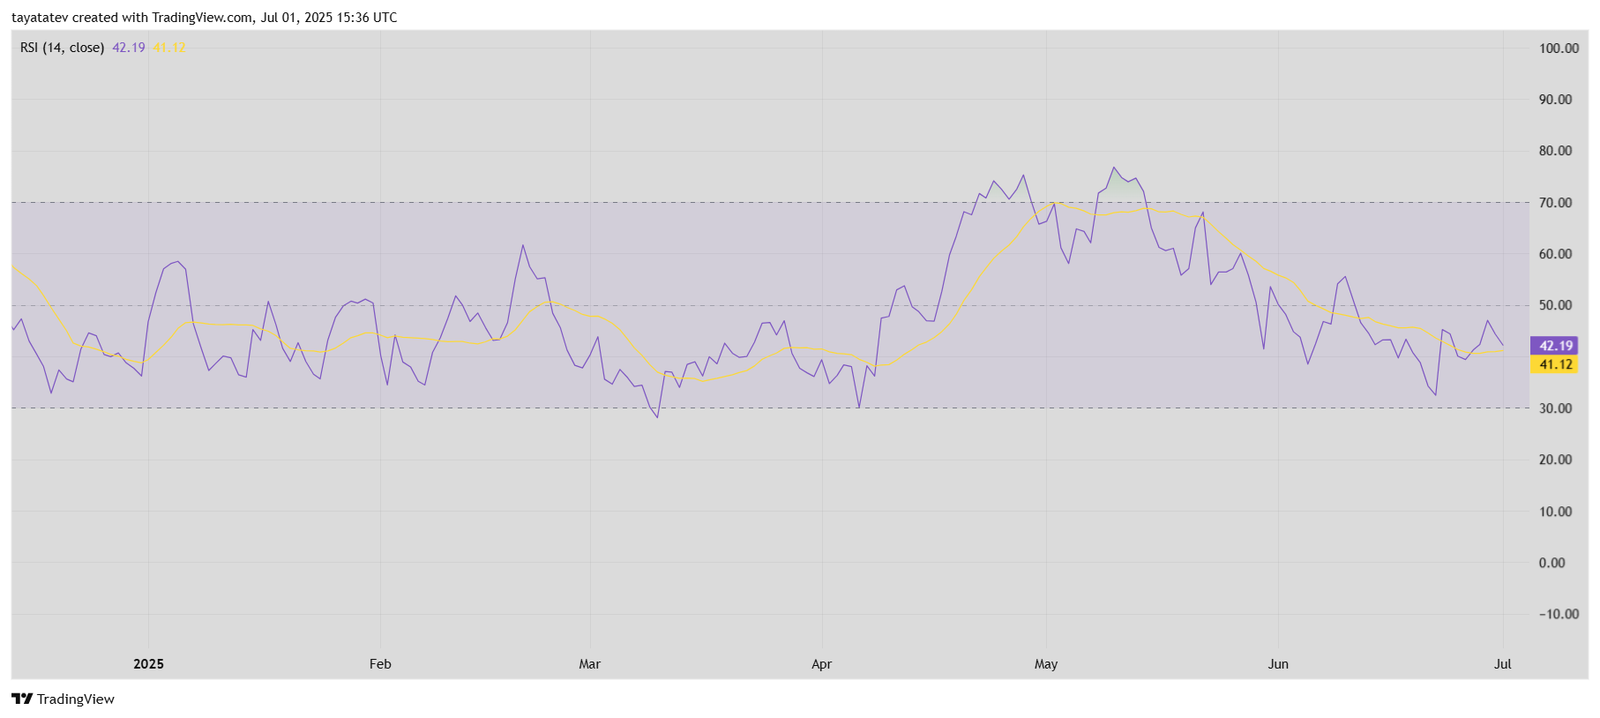
Currently, TAO’s RSI sits below the 50-neutral midpoint but above the oversold threshold of 30. This places it in a neutral-to-weak range. The RSI line (purple) is slightly above its 14-day Simple Moving Average (yellow), which is at 41.12. That crossover signals a modest shift toward buying pressure, though not yet strong.
Since mid-June, the RSI has been consolidating between 35 and 45, matching the sideways trend in price. Despite recent volatility, the indicator has not touched the oversold zone, meaning sellers have not dominated momentum.
If RSI continues to rise and crosses above the 50 mark, it may confirm strengthening momentum that aligns with a potential breakout from the bullish flag pattern. Until then, the RSI reflects caution among buyers, with no clear directional bias.
MACD Turns Positive for TAO on July 1
On July 1, 2025, the Moving Average Convergence Divergence (MACD) indicator for Bittensor (TAO/USDT) showed early signs of a potential trend reversal. The MACD line (blue), calculated using the 12-day and 26-day Exponential Moving Averages, crossed above the signal line (orange), which is the 9-day EMA of the MACD. This crossover occurred just as the histogram flipped green with a value of 0.9, marking a positive momentum shift.
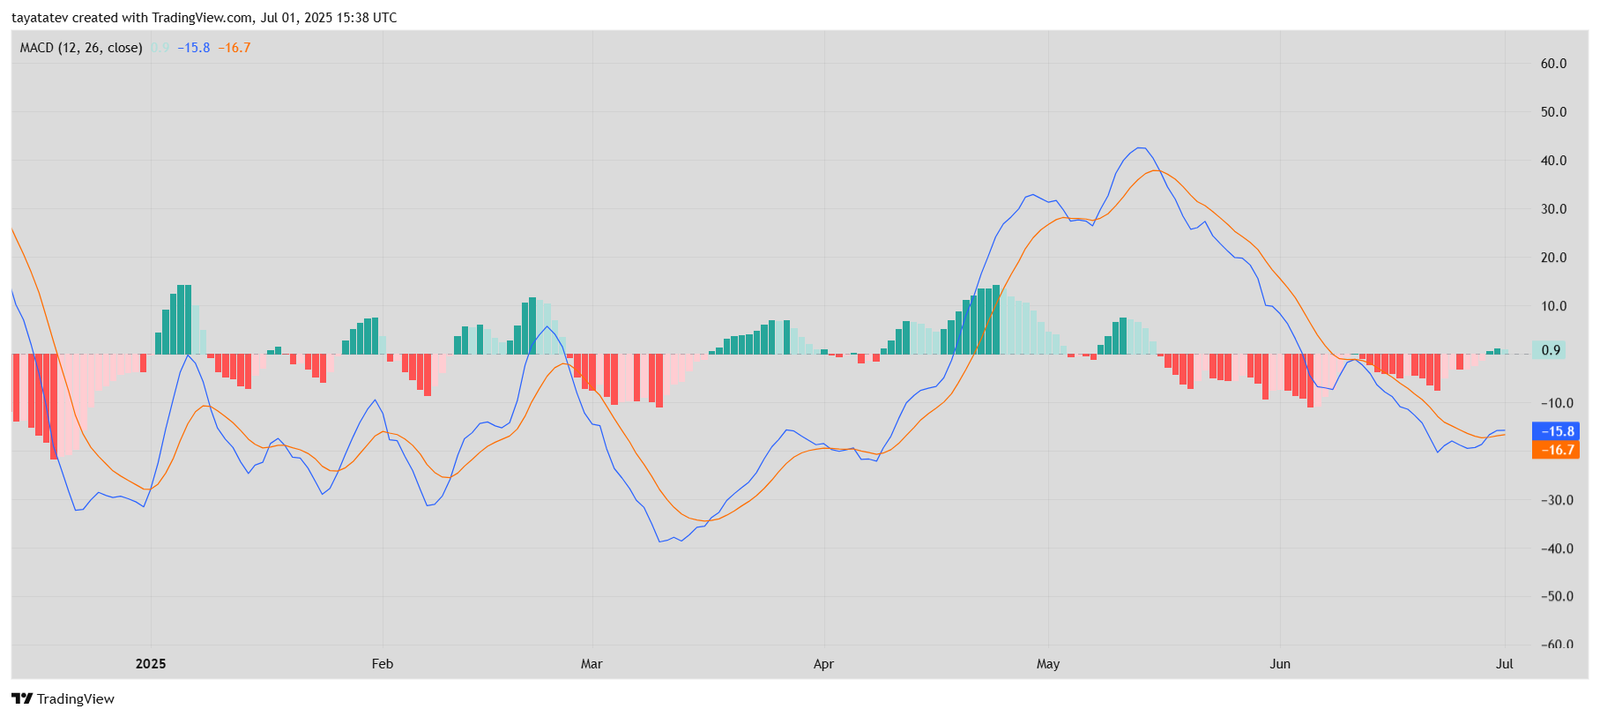
At the time of the chart, the MACD line stood at –15.8, while the signal line showed –16.7. Although both values remained below zero, the rising trend indicates a possible recovery from recent bearish pressure.
The MACD histogram had remained in red since early June, signaling negative momentum. However, in the last few sessions leading up to July 1, the red bars narrowed, and green bars appeared—indicating increasing bullish momentum.
This crossover is significant because it confirms growing buying interest just as the price tests the upper resistance of the bullish flag pattern. When MACD turns positive while the price consolidates near resistance, it often supports a breakout scenario.
In summary, TAO’s MACD indicator turned bullish on July 1 as the MACD line crossed above the signal line and the histogram moved into green territory. This change in momentum aligns with other technical signals and supports the case for a possible price breakout.
