
21Shares filed a preliminary application with the U.S. Securities and Exchange Commission (SEC) on Tuesday. The request seeks approval for a spot ETF that will directly hold ONDO token, the native asset of Ondo Finance.
The fund is listed under the name 21Shares Ondo Trust. According to the filing, it will track the CME CF Ondo Finance-Dollar Reference Rate. The product will function as a passive investment vehicle, and Coinbase Custody will manage the ONDO holdings.
The ETF will not use leverage or speculation. Authorized participants will have the option to create or redeem shares in cash or in-kind. The structure mirrors other digital asset spot ETFs previously submitted to the SEC.
ONDO Token Price Drops From December High
The ONDO token is priced at $1.12, down 48% from its all-time high of $2.14 in December, according to CoinGecko. The market capitalization stands at $3.5 billion, with 3.1 billion ONDO tokens in circulation out of a 10 billion total supply.
ONDO powers the Ondo Chain, a proof-of-stake blockchain focused on institutional use cases, including tokenized real world assets. The chain is designed to support compliant and regulated financial activity.
Tokenized assets on blockchain have seen strong growth. According to RWA.xyz, the on-chain value of tokenized real world assets increased 58% in 2025, reaching nearly $25 billion. Most of these assets are on Ethereum, which holds a 55% market share.
Trump ONDO Holdings Appear in DeFi Portfolio
In December 2024, World Liberty Financial, a DeFi platform linked to the Trump family, added ONDO to its holdings. Data from Nansen shows that the platform purchased $250,000 worth of ONDO and now holds 342,000 tokens, valued at around $383,000.
The Trump ONDO holdings represent 0.2% of a $208 million portfolio, which mainly contains stablecoins, wrapped Ether (ETH), and Bitcoin (BTC). The ONDO allocation is minor but has drawn attention due to the political link.
The holdings have not led to significant ONDO price changes. However, the association between ONDO and a politically connected DeFi platform remains a documented part of its distribution.
Ondo Finance Acquires SEC-Registered Oasis Pro
Ondo Finance acquired Oasis Pro earlier this month. Oasis Pro is a broker-dealer registered with the SEC, a transfer agent, and an Alternative Trading System (ATS). It has also been a member of FINRA since 2020.
The acquisition supports Ondo Finance’s goal to offer tokenized securities through regulated platforms. The company plans to work with Pantera Capital to launch these offerings. The new tools will operate on Ondo Chain, which was introduced in February as a dedicated blockchain for financial institutions.
The acquisition enables Ondo to manage ownership records and secondary trading for tokenized assets in a compliant structure. With these licenses, Ondo can now handle the issuance and transfer of digital securities under U.S. rules.
RWA Market Expands With Ethereum Dominance
The market for tokenized real world assets has grown quickly in 2025. According to RWA.xyz, on-chain tokenized asset value rose 58%, bringing the total to nearly $25 billion. These assets include private credit products and U.S. Treasury instruments.
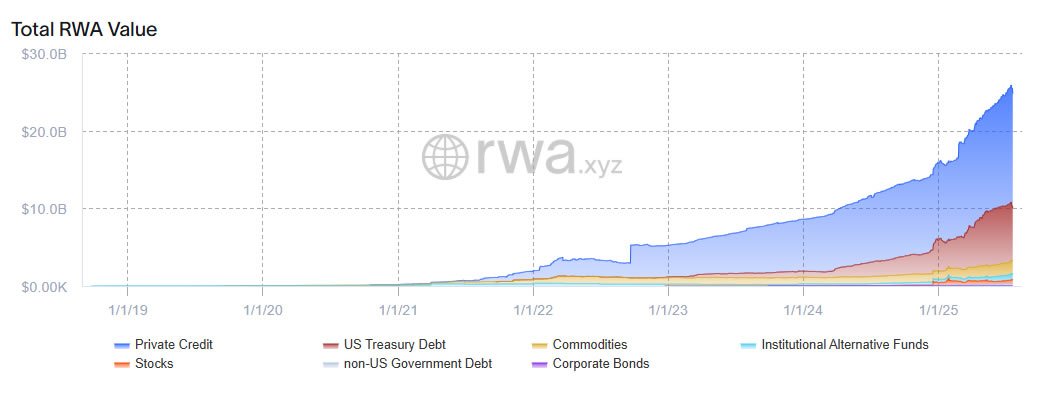
Ethereum remains the leading blockchain in this area, with 55% of all tokenized assets. New platforms like Ondo Chain aim to take market share by offering compliance-ready systems built for regulated financial products.
The ONDO token remains central to this strategy. Through Ondo Finance, ONDO continues to build links between traditional finance and blockchain-based systems using regulatory approvals and licensed infrastructure.
ONDO Price Tests Support After Channel Breakdown
The ONDOUSDT 4-hour chart from July 24, 2025, shows the price moving inside an ascending parallel channel that began in mid-June. The upper resistance of this channel reached near $1.21, while the lower support consistently held around $1.02. ONDO touched both the upper and lower bounds multiple times, confirming the structure’s relevance over the past month. However, recent candles show that the token dropped below the lower trendline and is now struggling to hold the former support.
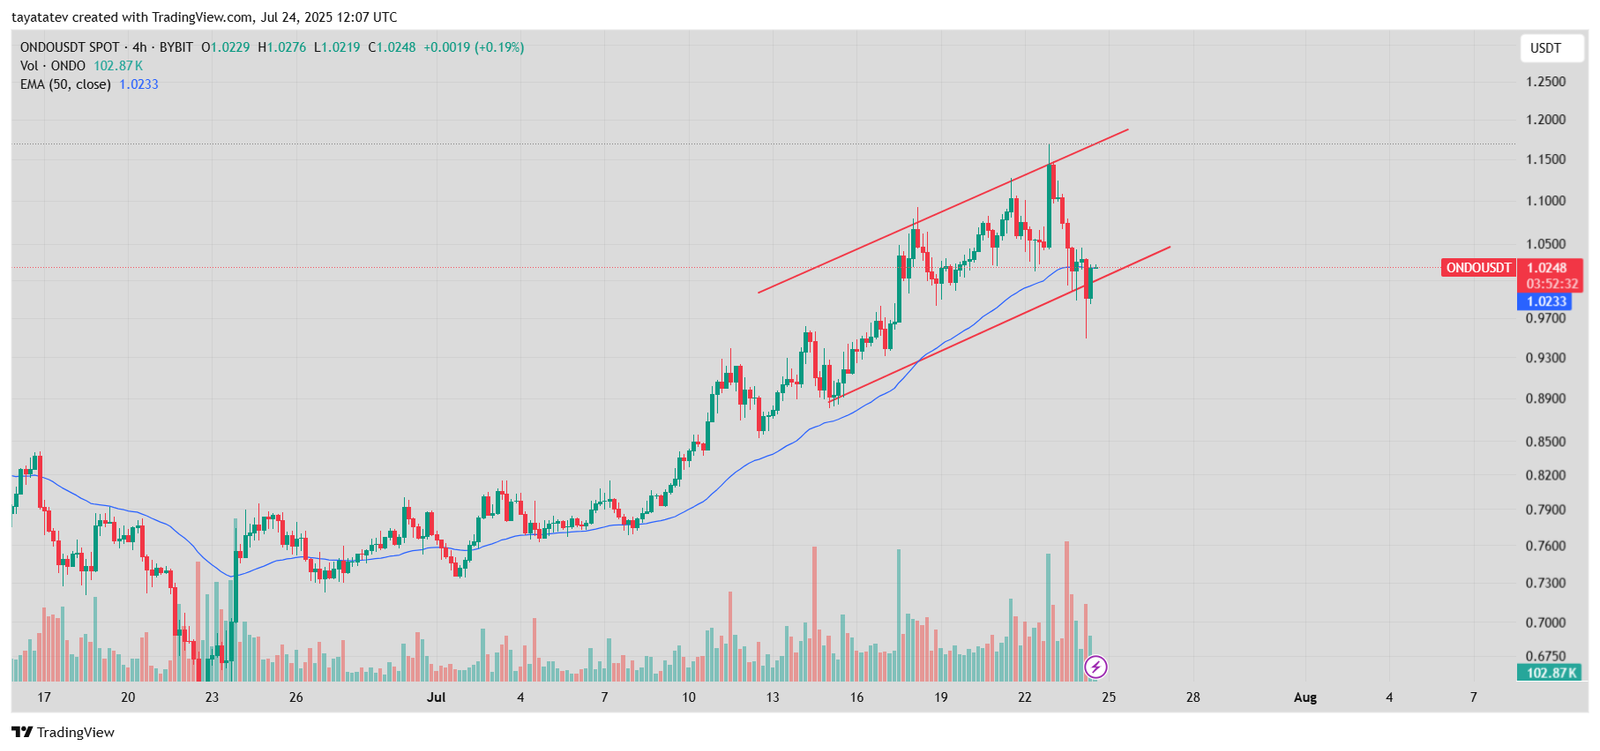
The breakdown happened with increased selling volume, followed by a weak bounce attempt. ONDO now trades at $1.0248, hovering just above the former channel support and very close to the 50-period exponential moving average (EMA), which currently stands at $1.0233. The price tried to re-enter the channel but failed to close strong above $1.02, suggesting that the breakdown may not be a false move. If ONDO closes multiple candles below $1.02, it could indicate a confirmed trend reversal. The price may then test lower levels near $0.96 or $0.91, which acted as support in early July.
At the same time, resistance has formed around $1.10, a level ONDO failed to cross during its last upward attempt. For bullish recovery, ONDO must reclaim that zone and show consistent strength above it. The recent drop in volume during the bounce shows limited buyer interest after the breakdown. Unless buying pressure returns, the EMA and former support may flip into resistance. For now, ONDO trades at a critical point, with any decisive move below $1.02 likely to lead to more downside.
ONDOUSDT RSI Drops Below Neutral Zone
The ONDOUSDT Relative Strength Index (RSI) chart, captured on July 24, 2025, shows the RSI falling to 45.03, below the neutral 50 level. This move indicates that the recent momentum has turned slightly bearish. The RSI line has been trending downward since mid-July, with lower peaks and lower troughs, which reflects weakening buying pressure. The yellow moving average of the RSI is at 50.91 and remains above the RSI line, further confirming the short-term weakness in momentum.
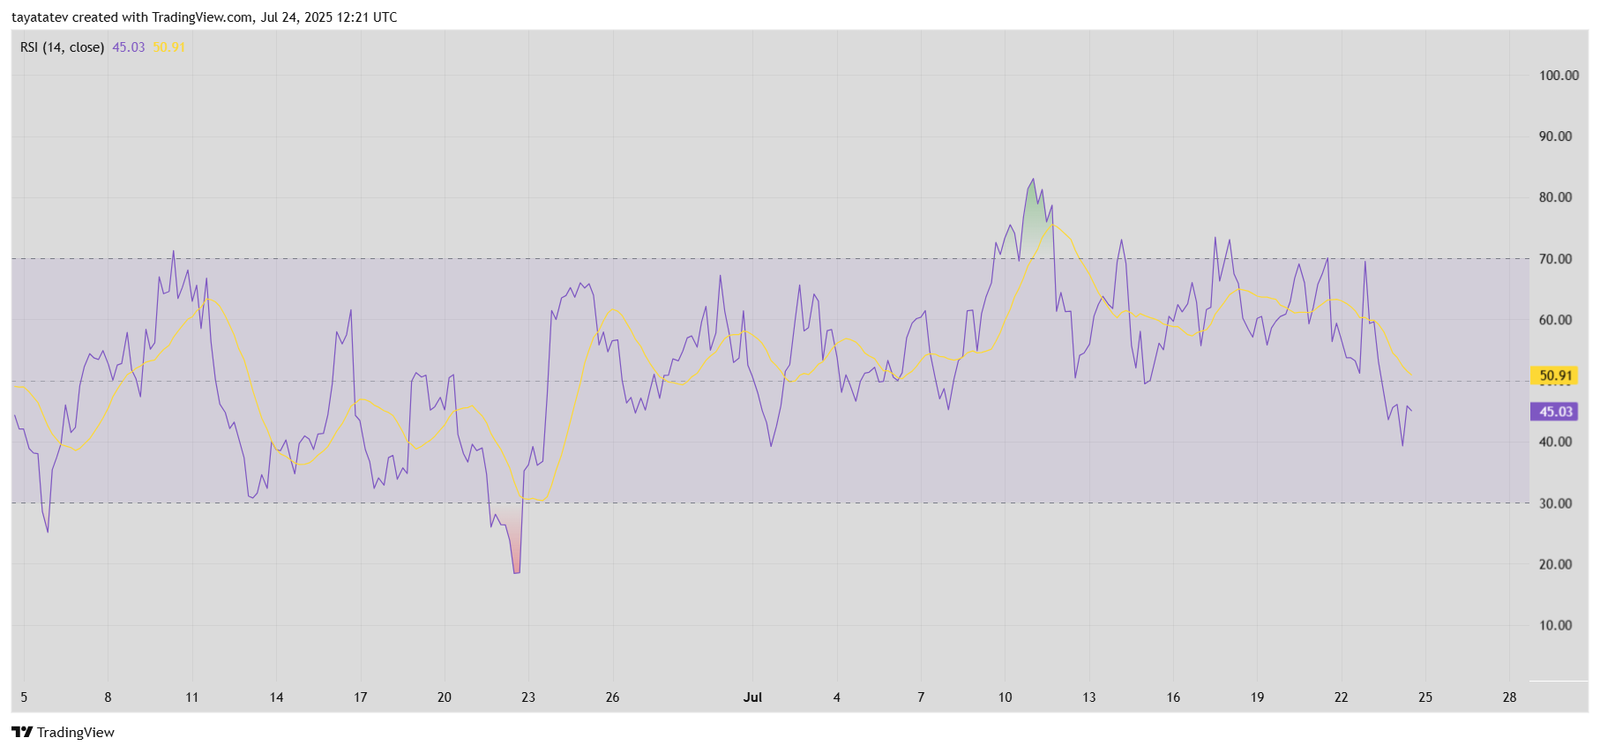
During the last few days, ONDO’s RSI has stayed mostly between 40 and 70, showing moderate volatility. However, the current breakdown below the moving average signals that sellers are gaining control. If the RSI drops below 40, the asset could enter a stronger bearish phase, especially if accompanied by increased volume and price action below key support levels.
The RSI has not reached oversold levels yet. It remains above 30, which means there’s still room for the downside to extend without triggering a technical bounce. The current reading suggests caution for buyers, as the chart now reflects a shift from neutral to mild bearish momentum. Any sharp change in price will likely appear first in this RSI zone if the trend direction changes.
