
Key Takeaways:
- Ethereum followed Bitcoin and hit a new all-time high on Oct 20.
- The ongoing supply squeeze also contributed to the uptrend.
- On-chain metrics support the bullish stance.
YEREVAN (CoinChapter.com) – Ethereum’s native token Ether (ETH) broke the $4,000 psychological resistance level and traded at $4,110 in the New York session Wednesday. The rally came in the wake of Bitcoin registering a new all-time high at $67,016 hours earlier.
What fueled Ethereum?
Bitcoin’s rally to a new all-time high was one of the reasons behind ETH’s bullish market outlook. Lately, the alpha altcoin has been exhibiting a positive correlation with BTC on the charts.
Sep 6-13 Bitcoin lost 15%, and Ethereum followed a similar pattern, losing 17%. Sep 18-21, the flagship cryptocurrency dove by another 15%. ETH complied and declined by 20.5%.
The correlation continued into the uptrend as well. While Bitcoin put on almost 60% quarter-to-date, the second-largest cryptocurrency by market cap was 58% in the same period.
Related: Newsflash: Bitcoin hits a fresh milestone high, crosses $66.1K on ETF FOMO
The continuing supply squeeze also fueled Ethereum’s rally. Over 583 thousand ETH tokens have been burned so far, with the rate of 5.09 ETH a minute, worth roughly $2.3 billion. In hindsight, the supply shortage came from EIP-1559, an improvement protocol the blockchain implemented as a part of the transition to Ethereum 2.0 upgrade.
Moreover, on-chain metrics show that the traders’ confidence in the smart contract platform continues to rise. For example, analytical platform Glassnode reported that the number of addresses holding over 0.01ETH has consistently increased and hit an all-time high of 18.1 million.
Additionally, the total value in the Ethereum 2.0 Deposit Contracts peaked at almost 8 million ETH. In detail, the traders who wish to stake their ETH in the new consensus mechanism should allocate their tokens to the mentioned Deposit Contract addresses.
Also read: Ethereum hitting $6.5K in Q4 is possible due to this critical ETH indicator.
ETH daily chart
The technical indicators on Ethereum’s daily chart suggest a bullish continuation underway. Furthermore, the digital asset broke above a significant resistance line on Oct 20 and could retest it as support should a setback occur.
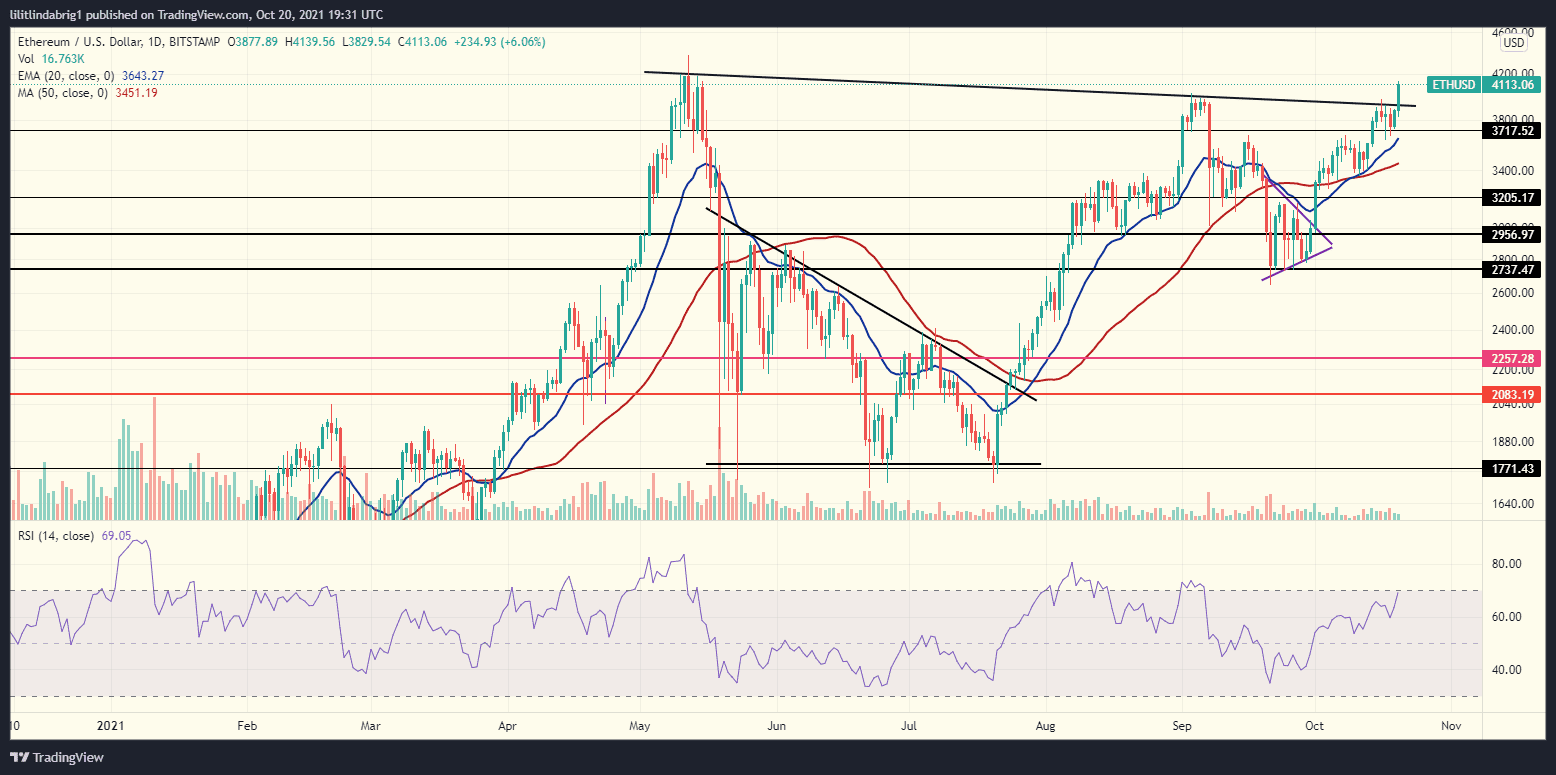
As a result of the bullish price action, the relative strength index (RSI; momentum indicator) climbed up to 70, which shows the traders’ growing confidence in the asset. Additionally, the low trading volumes (vertical bars at the bottom of the chart) indicate their willingness to hold ETH rather than trading it for other digital or fiat currencies.
Also read: Ethereum addresses holding more than 1 Ether hits record high as ETH holds $3.8K.

… [Trackback]
[…] Find More Info here to that Topic: coinchapter.com/ethereum-eth-breaks-above-4k-in-the-wake-of-bitcoins-record-rally/ […]
… [Trackback]
[…] Read More to that Topic: coinchapter.com/ethereum-eth-breaks-above-4k-in-the-wake-of-bitcoins-record-rally/ […]
… [Trackback]
[…] Find More on to that Topic: coinchapter.com/ethereum-eth-breaks-above-4k-in-the-wake-of-bitcoins-record-rally/ […]