
Shiba Inu price has slipped again, showing weakness across the memecoin sector. At press time on August 20, 2025, SHIB was down 0.6% daily and has declined more than 17% in the last 30 days.
The broader decline reflects mounting bearish signals on the charts. Shiba Inu has now broken important support levels, pointing to deeper downside risks.
Despite the weakness, one indicator suggests that accumulation by top holders could still influence market direction.
Active Shiba Inu Addresses Near Record Lows
On-chain data shows a steady drop in network activity. Daily active addresses fell to 3,148, only slightly above the monthly low of 3,130.
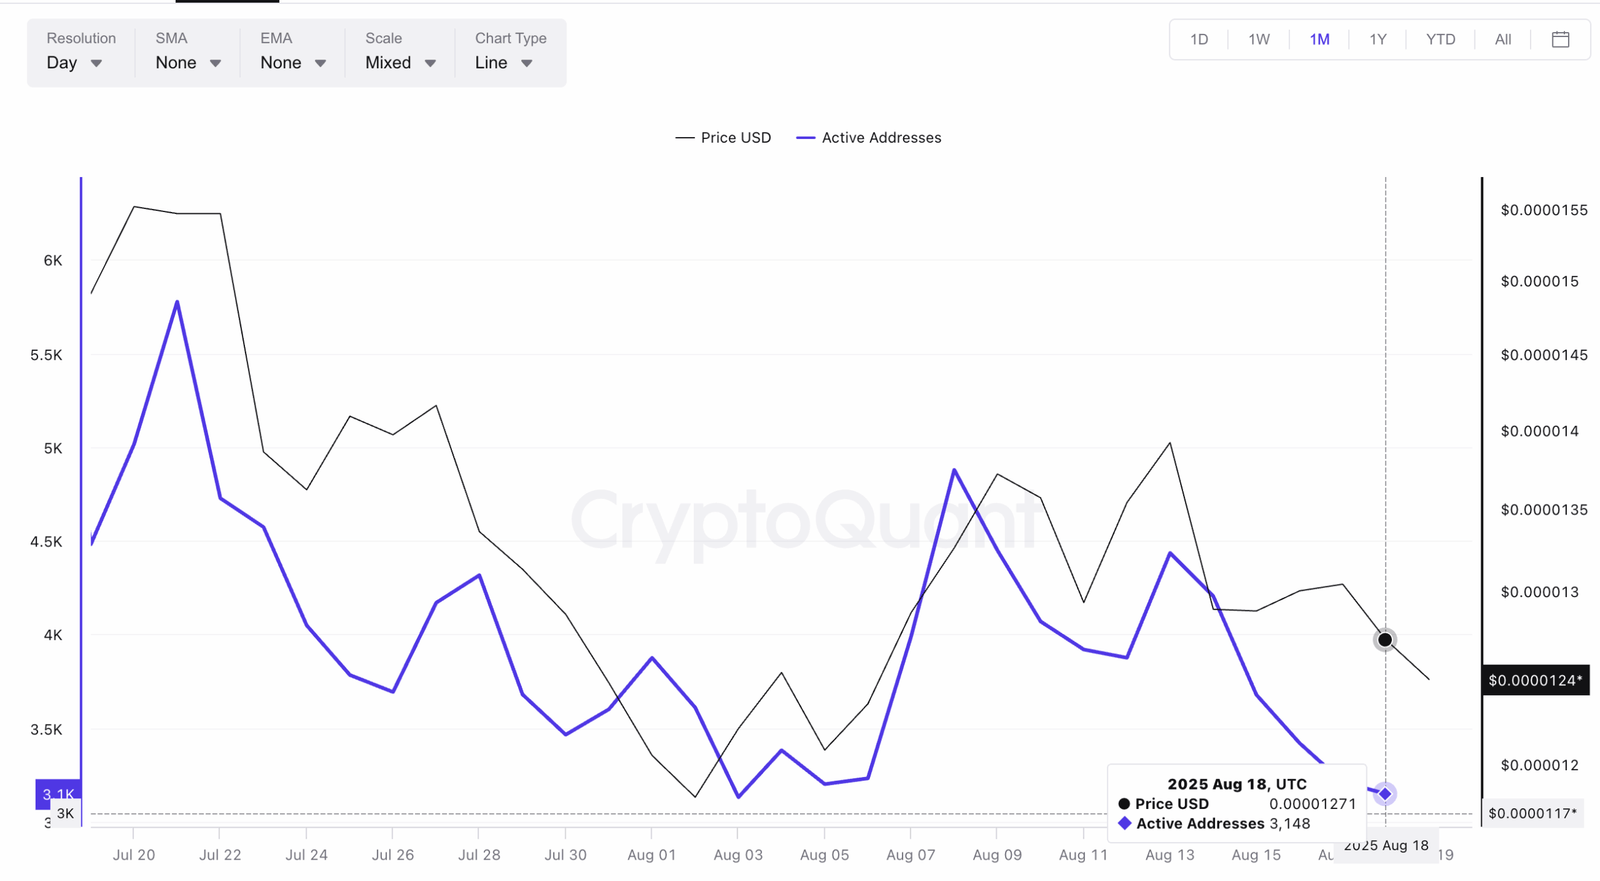
This decline matters because earlier surges in active addresses have often preceded quick rebounds. For example, between August 6 and 8, active addresses spiked, and SHIB price responded with a short rally.
At the moment, falling activity aligns with broader bearish pressure. The Bull-Bear Power (BBP) indicator, which tracks the gap between daily highs or lows and a moving average, confirms this trend.
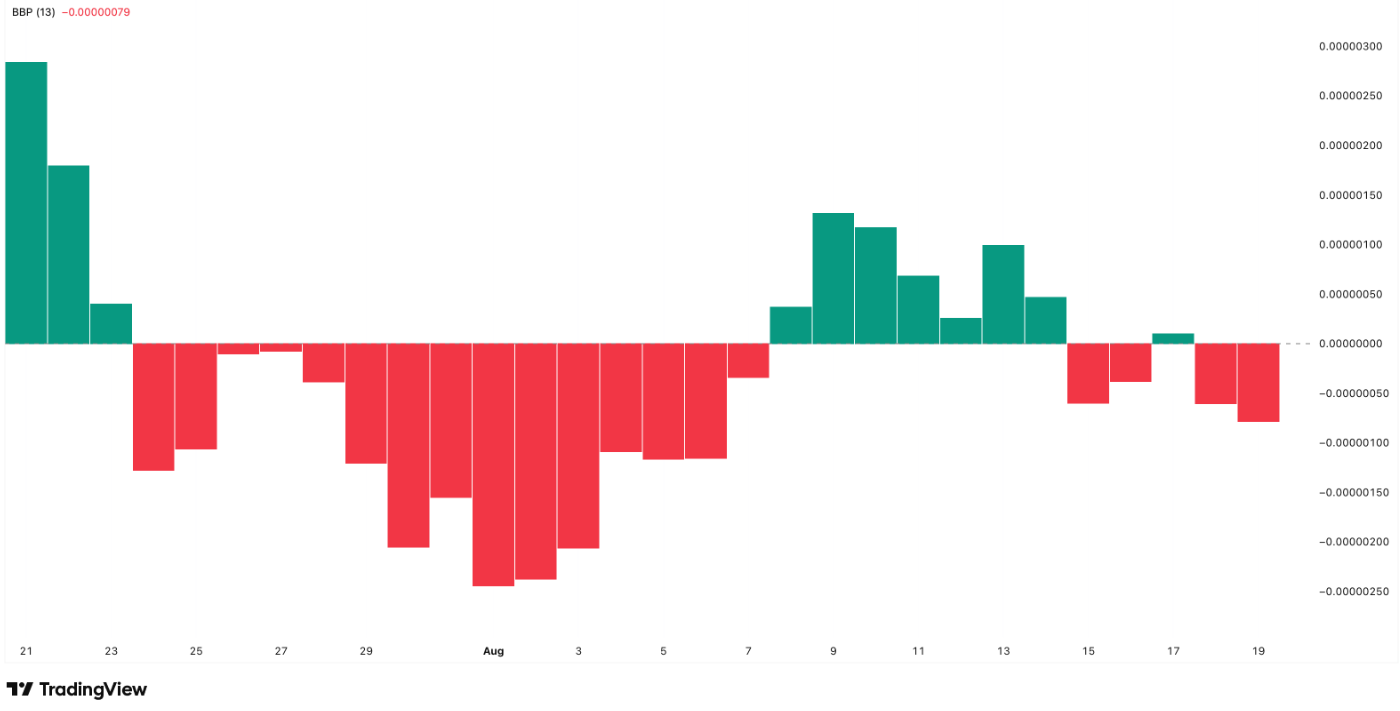
The BBP has stayed in negative territory for much of late July and early August, signaling dominant selling pressure. Extended red bars on the chart show that bears had control during this period, pushing Shiba Inu price lower.
There were brief recoveries between August 8 and 13, with green bars reflecting temporary bullish strength. However, these positive spikes failed to sustain momentum. Since August 15, the BBP has slipped back into negative values, with readings around -0.00000079 on August 19, showing renewed bearish control.
This pattern highlights that while short rallies appear, sellers continue to outweigh buyers overall. The indicator reinforces the downward momentum already visible in Shiba Inu’s price action and network activity.
Shiba Inu Whales Show Accumulation
While smaller traders appear to be stepping back, whale wallets are acting differently. Data shows that the top 100 SHIB addresses have accumulated nearly 21 trillion SHIB in 90 days.
This accumulation is also visible in the Chaikin Money Flow (CMF) indicator, which remains above the zero line. A CMF reading above zero typically shows net inflows of capital, meaning significant buying pressure despite declining sentiment.
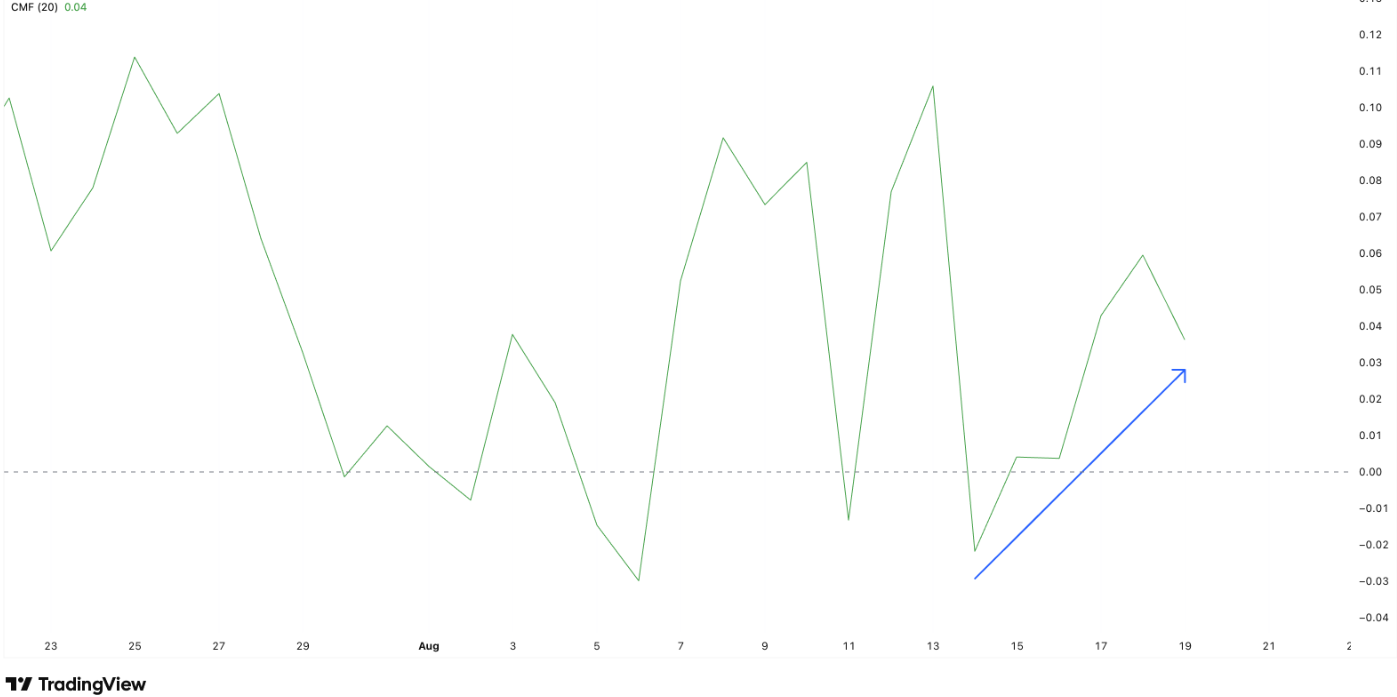
The CMF has also been forming higher lows, suggesting consistent inflows. Analysts note that this trend often reflects institutional or whale-level accumulation even when retail activity slows.
Shiba Inu Price Forms Falling Wedge Pattern on August 20 Chart
On August 20, 2025, the Shiba Inu to U.S. Dollar (SHIB/USD) 4-hour chart shows a distinct falling wedge pattern. The formation appears after weeks of declining prices, with lower highs and lower lows creating two downward-sloping converging lines.
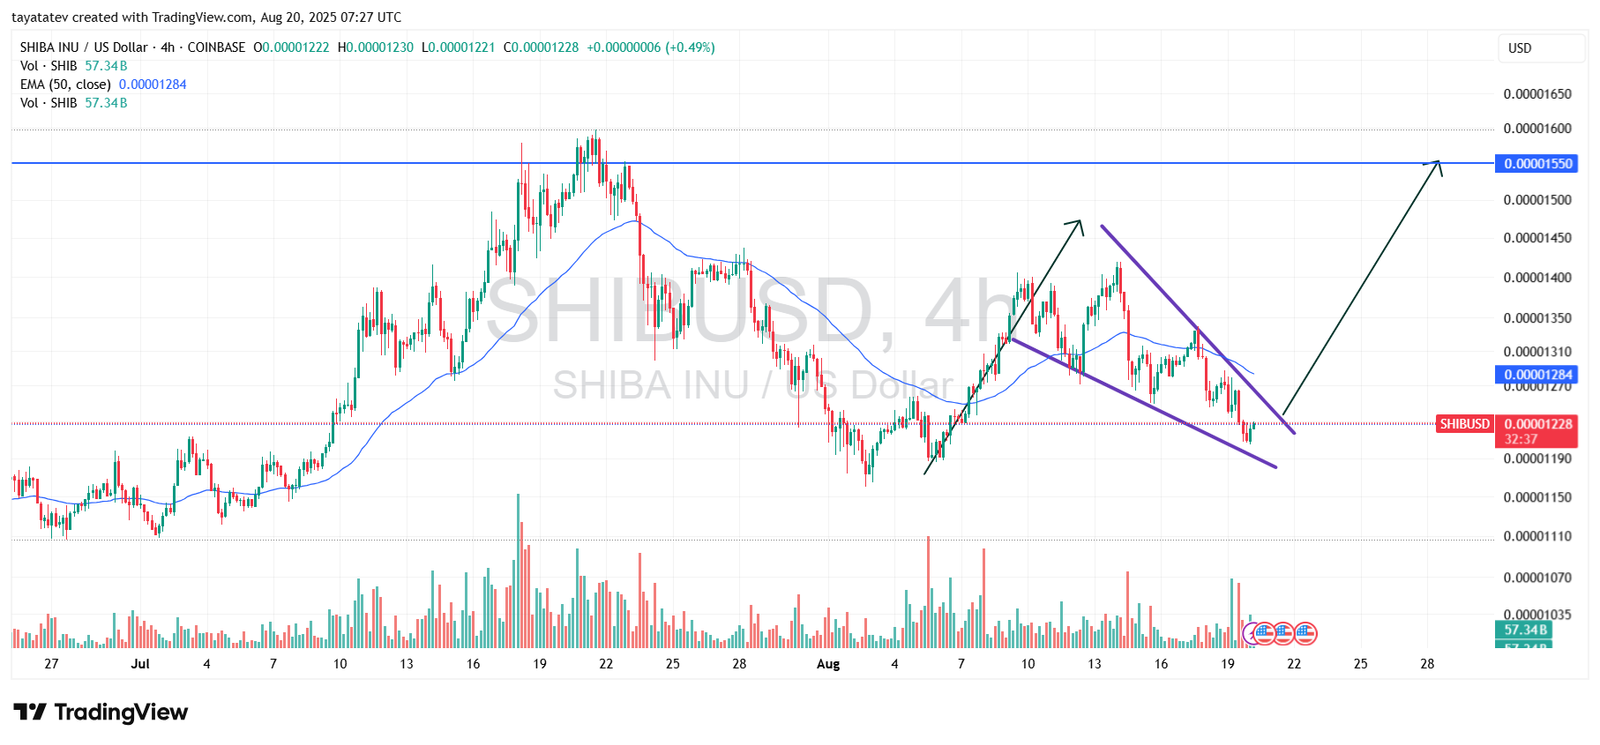
A falling wedge is generally considered a bullish reversal pattern. It often signals that bearish pressure is slowing down while buyers begin to prepare for a breakout to the upside. In this case, the wedge structure suggests that Shiba Inu could be nearing a turning point.
At the moment, SHIB trades near 0.00001228, sitting just under the 50-period exponential moving average (EMA) marked at 0.00001284. If the breakout confirms, the projected move points to nearly a 26 percent rise from the current level. This would lift the price toward the 0.00001550 resistance zone, which is the next significant ceiling visible on the chart.
Volume trends also support this setup. Earlier surges in trading activity around July align with upward pushes, and although volume has cooled, the wedge narrowing signals a potential breakout move as pressure builds.
If bulls manage to clear the 50-EMA barrier, the path toward 0.00001550 becomes more realistic. However, until the price escapes the wedge decisively, short-term consolidation remains possible within the narrowing channel.
Shiba Inu RSI Shows Bearish Weakness on August 20
On August 20, 2025, the Shiba Inu to U.S. Dollar (SHIB/USD) chart highlights the Relative Strength Index (RSI) over a 14-day period. The indicator now reads 37.93, with its moving average slightly higher at 38.28.
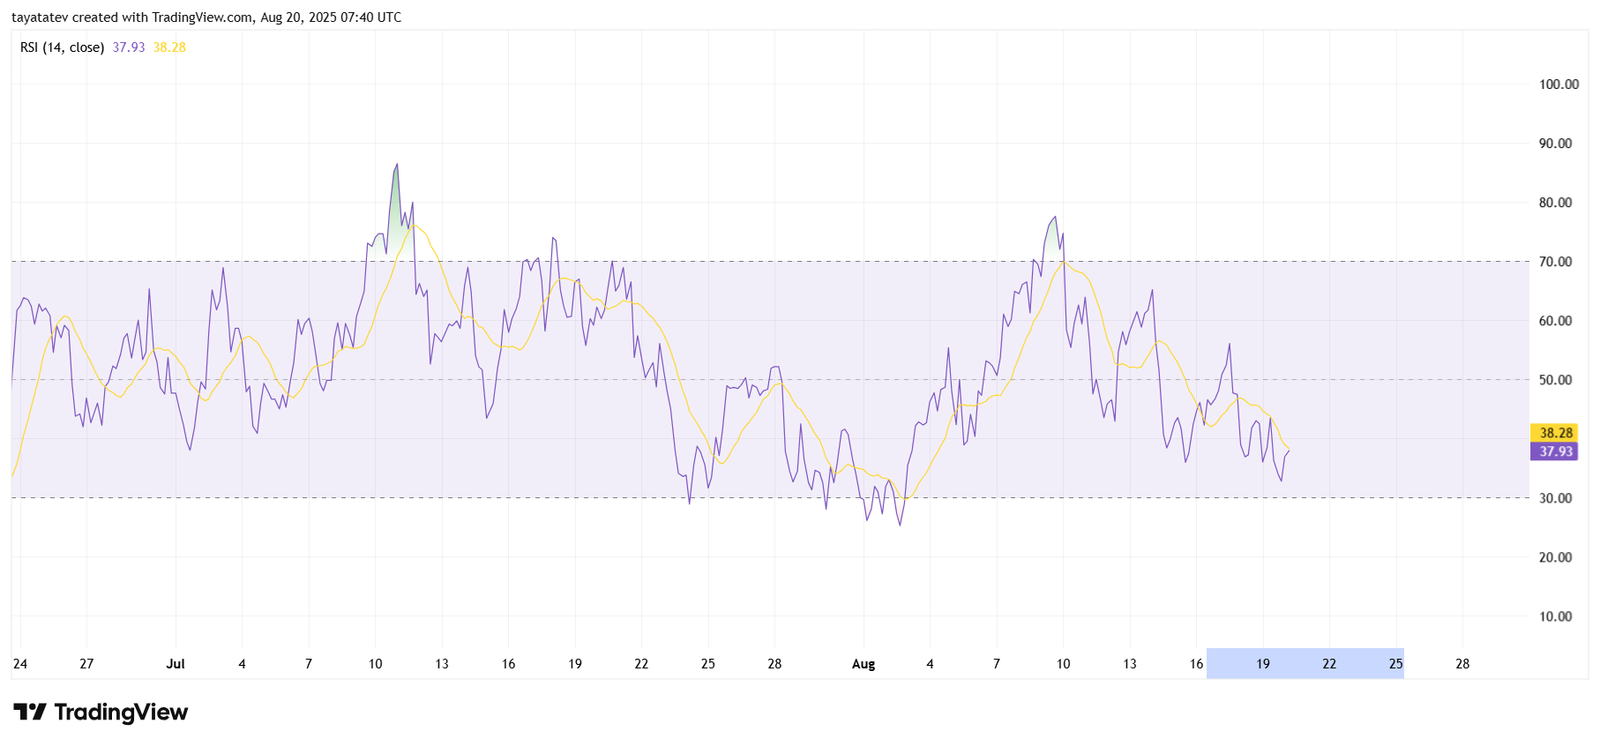
The RSI measures momentum by comparing the size of recent gains against losses. Values above 70 typically suggest overbought conditions, while values below 30 indicate oversold territory. Current readings place SHIB near the lower boundary of the neutral zone, signaling weakening momentum without yet entering oversold conditions.
The chart shows that RSI peaked above 80 on July 10, reflecting strong bullish energy at that time. However, the indicator quickly reversed, and since late July, it has remained under the 50 midpoint line for most sessions. This consistent position below 50 confirms bearish dominance in momentum.
More recently, from August 15 to 20, the RSI slipped further toward the 30 threshold. The short-term moving average also trends downward, reinforcing the view that sellers remain in control. Unless RSI rebounds toward the mid-40s or higher, Shiba Inu is likely to face continued pressure.
Market Context for Shiba Inu Price
The recent decline in Shiba Inu places it within the broader wave of memecoin pullbacks, as other major tokens also face corrections. Despite the bearish pressure, wallet behavior highlights a clear divide among different categories of holders.
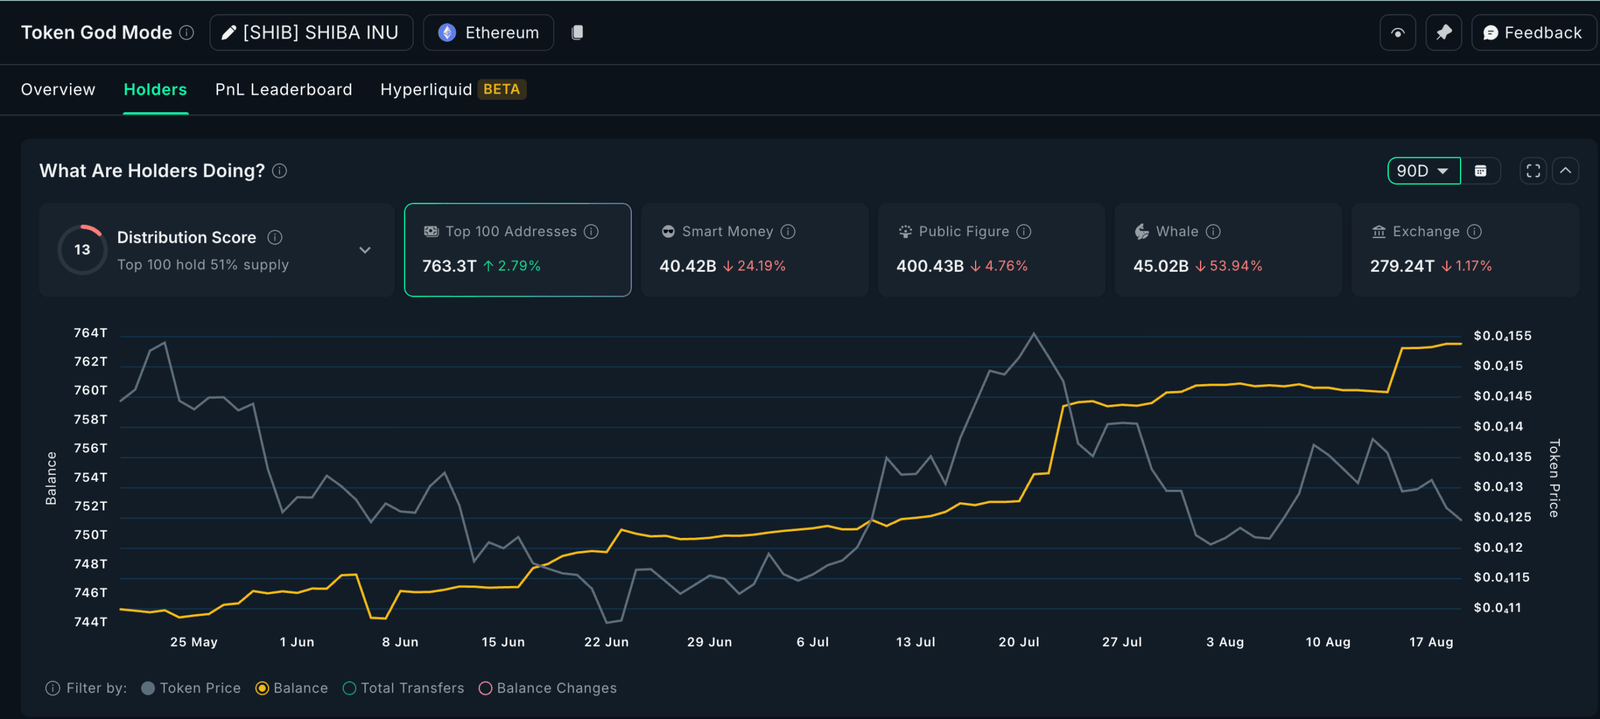
The top 100 Shiba Inu addresses increased their holdings by nearly 2.79 percent in the past 90 days, now holding about 763.3 trillion SHIB. This steady rise underscores accumulation among the largest wallets, even as price momentum remains weak. Their buying reflects consistent inflows that help keep balance levels near record highs, shown by the rising yellow line on the chart.
In contrast, Smart Money wallets, which often belong to active traders, cut their exposure sharply by more than 24 percent, reducing holdings to 40.42 billion SHIB. Similarly, wallets tied to public figures trimmed positions by about 4.76 percent, while whales offloaded more aggressively, dropping their balance by nearly 54 percent to 45.02 billion SHIB.
Exchanges also saw a mild decline of 1.17 percent, with balances falling to 279.24 trillion SHIB. This small shift suggests that some tokens have left exchange wallets, possibly signaling transfers to private holdings.
The divide between accumulation by the top 100 addresses and distribution by Smart Money and whales highlights mixed sentiment across the market. While retail and mid-tier investors appear cautious, the largest holders continue to build positions. This ongoing contrast could play a key role in shaping whether Shiba Inu stabilizes or faces further pressure in the coming weeks.
