
BlackRock has purchased $50 million worth of Ethereum (ETH), signaling growing corporate interest in the crypto sector. The blockchain intelligence firm Arkham reported the transaction on X, sharing data that shows rising Ethereum balances tied to the financial giant.
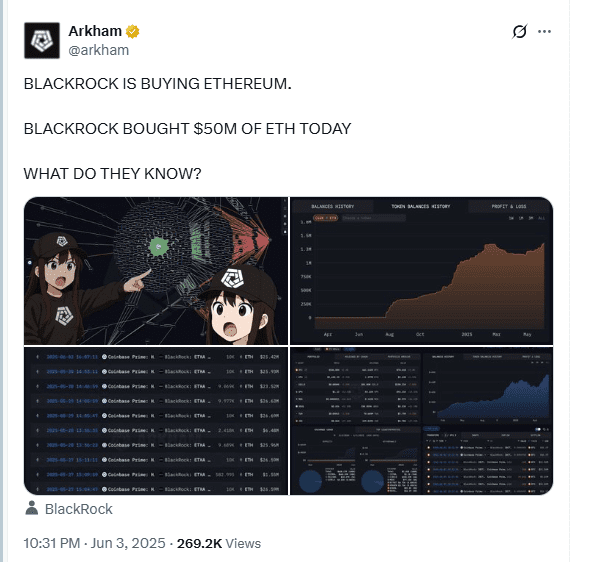
According to Arkham’s charts, BlackRock moved between 9,000 and 58,000 ETH in multiple transactions. These trades, tracked on Coinbase Prime, ranged from $23 million to $61 million in value. This activity suggests that BlackRock may be building a long-term Ethereum position.
The firm’s involvement strengthens the argument that institutional players are entering crypto markets more aggressively. It also raises questions about whether BlackRock has access to undisclosed information or is preparing for upcoming regulatory changes or new partnerships.
Ethereum Exchange Inflows Surge During Price Stability
From May 27 to June 4, Ethereum inflows to centralized exchanges spiked. Data from CryptoQuant shows that ETH exchange inflows jumped from around 200,000 ETH on May 27 to more than 1.3 million ETH by June 1, before declining again.
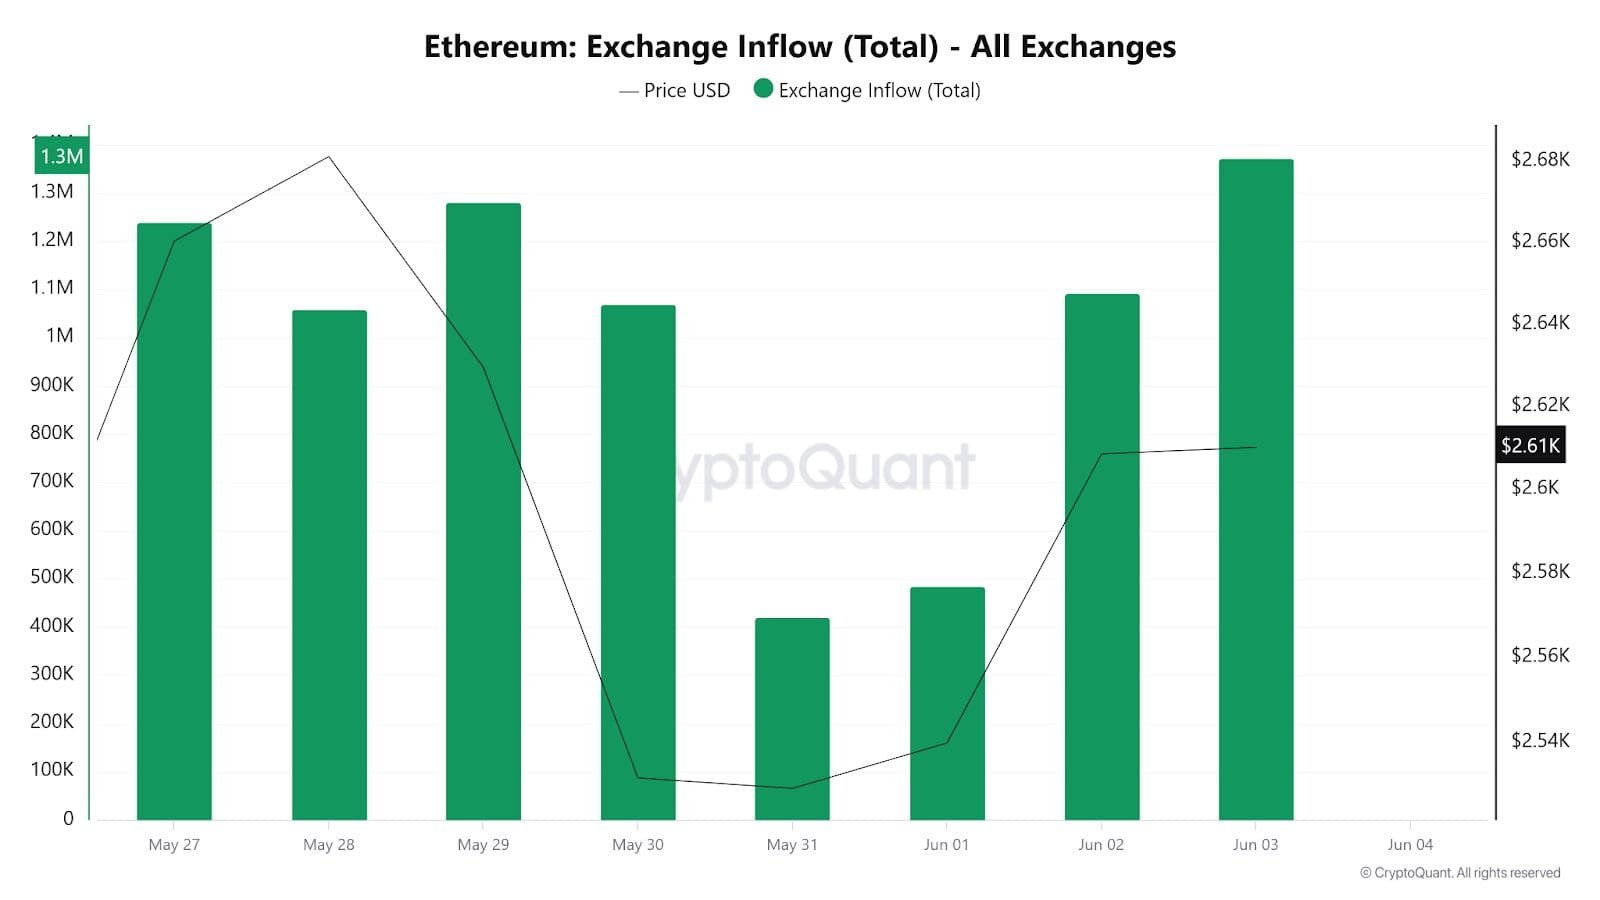
This rise in inflows occurred despite Ethereum’s price remaining relatively flat. The movement may point to increased selling or trading activity by investors.
BlackRock’s Ethereum accumulation, alongside rising exchange inflows, reflects growing activity among institutional and retail participants in the ETH market.
Whales Accumulate Billions in Ethereum as Wyckoff Pattern Signals $10K Target
Moreover, Ethereum is once again at the center of market attention as whales and institutions ramp up accumulation. Since May 8, trading volume has surged, indicating renewed interest from both buyers and sellers.
Crypto commentator Lark Davis pointed out that Ethereum has shown stronger resilience than Bitcoin in recent weeks. While Bitcoin slipped from its all-time high, ETH held on to a larger share of its value. This divergence, according to Davis, hints at underlying strength in Ethereum.
He also described Ethereum’s setup as “asymmetric long,” where the potential upside outweighs the risk. If Bitcoin holds or climbs, Ethereum could offer outsized returns—an opportunity that seasoned investors look for during accumulation phases.
Whales and Institutions Drive Massive Ethereum Accumulation
On-chain analyst Doctor Profit added that Ethereum wallets holding large amounts of ETH have grown rapidly. According to wallet tracking data, whales and institutions are actively buying. One of the key players is BlackRock, which recently increased its Ethereum exposure.
This sharp increase in accumulation supports a potential move back to the $3,000 level. Doctor Profit remains firm that Ethereum will likely break toward $4,000 soon, setting the stage for a new all-time high later this summer.
In the past two weeks, the number of wallets holding more than 10,000 ETH has risen sharply. This growth confirms a wave of silent accumulation among high-net-worth investors and institutions.
Wyckoff Model Hints at Breakout Toward $10K
Analyst Ash Crypto used the Wyckoff method to interpret Ethereum’s price structure. His chart shows that ETH completed all major stages of accumulation between $1,800 and $2,600. These include the preliminary support zone, selling climax, and the spring-and-test phases.
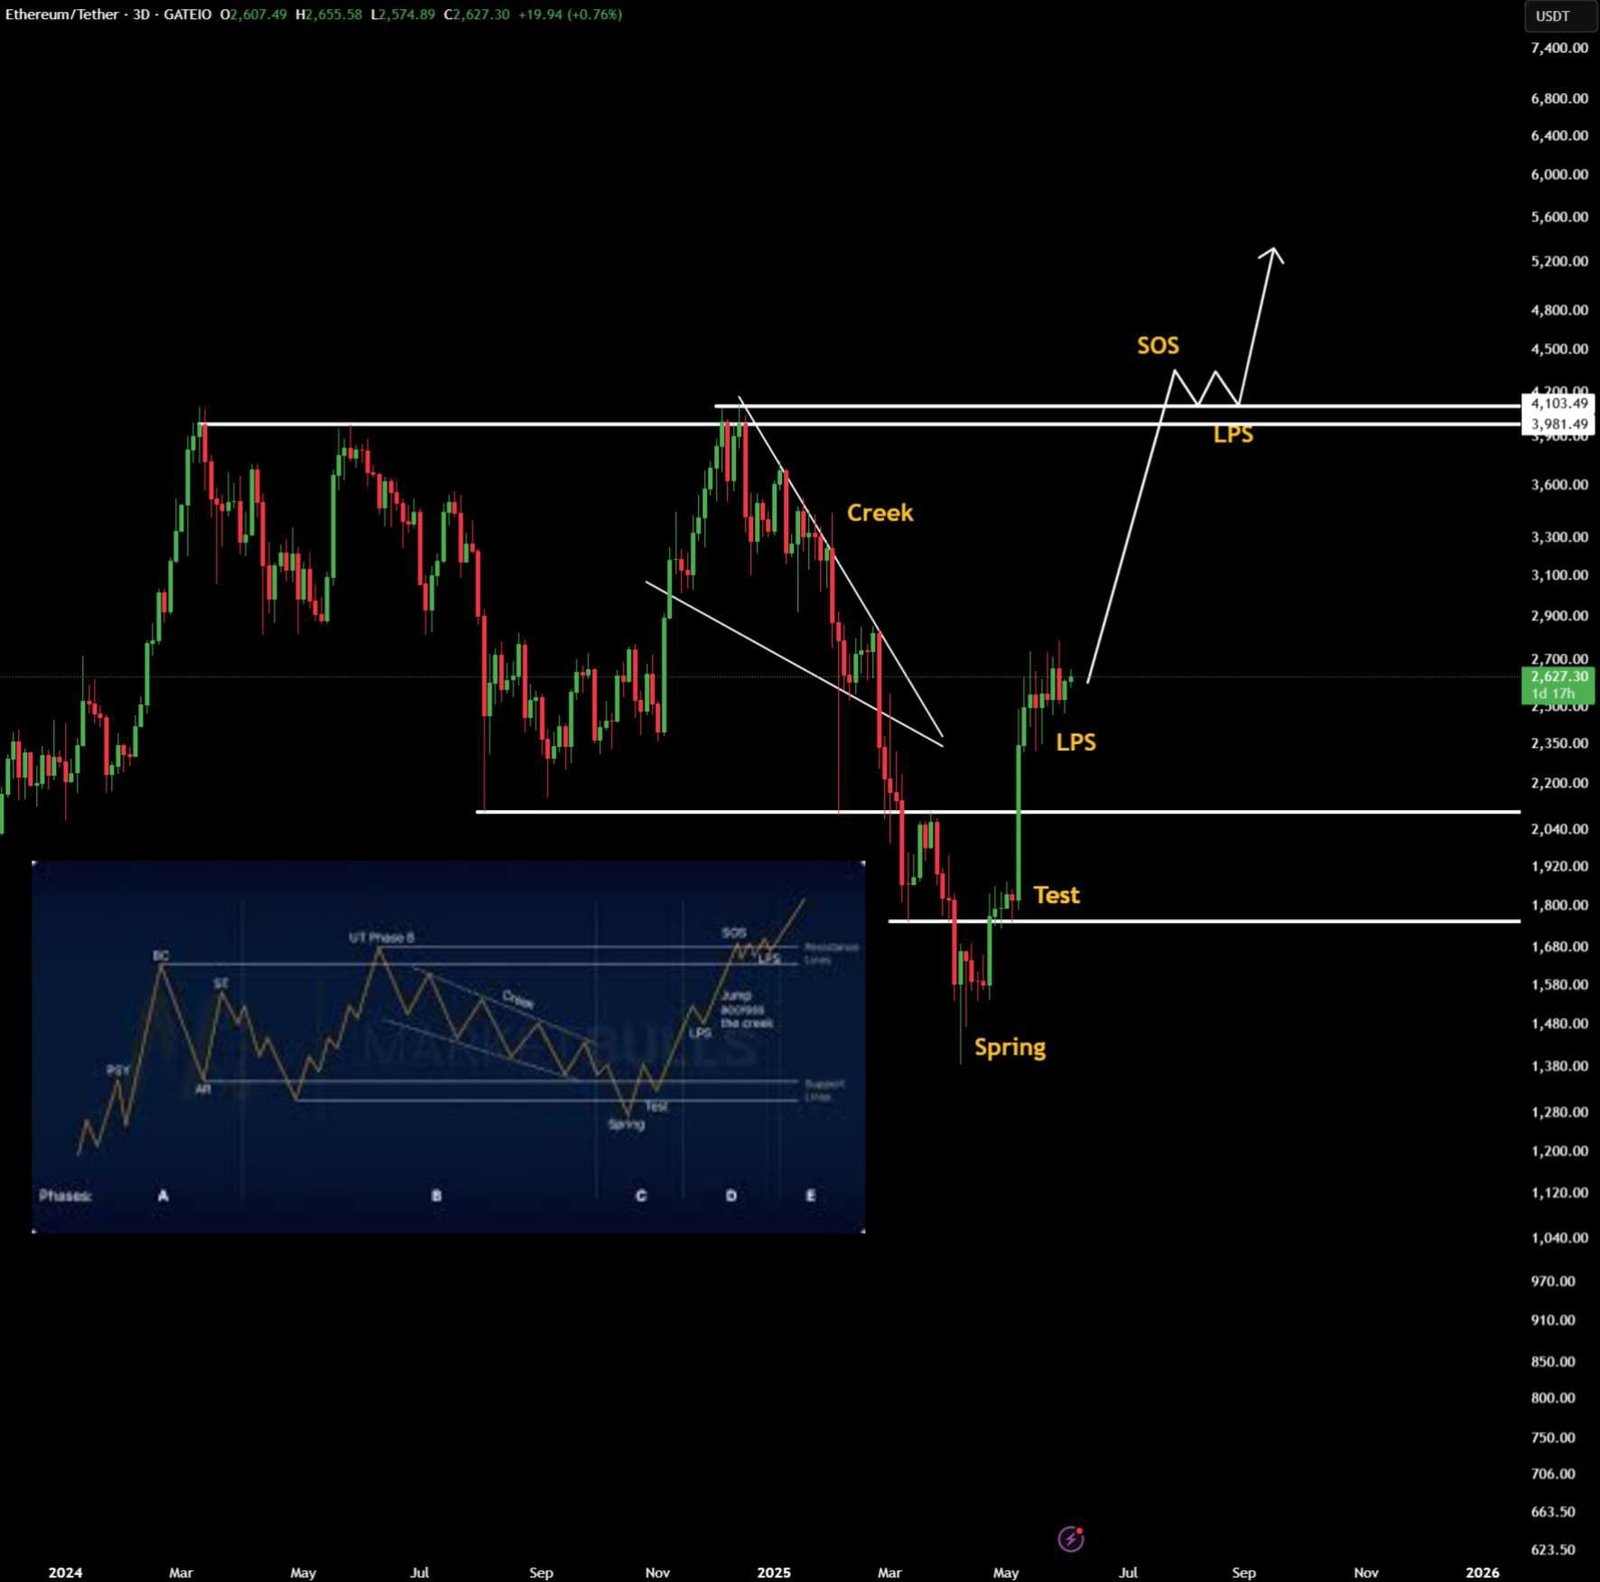
According to Ash Crypto, Ethereum already initiated a breakout toward the $3,000 mark. A successful reclaim of $3,100 would signal the start of a new markup phase. From there, a push to $4,000 becomes likely, paving the way for a rally toward the $10,000 zone in this cycle.
This forecast reflects growing confidence that Ethereum’s recent reaccumulation may lead to a much larger price surge than the market expects.
Ethereum Foundation Unveils New Treasury Strategy, Calls Next 18 Months ‘Pivotal’
Meanwhile, The Ethereum Foundation (EF) has announced a revamped treasury policy aimed at boosting financial efficiency and reinforcing support for its decentralized finance (DeFi) ecosystem. The update comes as the organization faces critical resource decisions and community concerns.

On June 4, EF director Hsiao-Wei Wang confirmed that the foundation would now tie operational expenses and funding allocations directly to its Ether (ETH) reserves and sales. The new strategy will allow EF to adjust spending based on market conditions and community feedback.
Wang revealed that the foundation currently holds enough cash for only 2.5 more years. She said the next 18 months will be crucial for Ethereum, requiring a sharper focus on essential deliverables and more deliberate resource use.
“This policy reflects our conviction that 2025–26 are likely to be pivotal for Ethereum,”
Wang stated.
The change follows criticism over recent unannounced ETH sales, which led to backlash from the community and raised concerns about transparency.
Quarterly Reports and DeFi Integration
To address those concerns, the Ethereum Foundation will publish quarterly and annual reports. These will detail its asset holdings, performance, and major treasury decisions to enhance public accountability.
As of October 31, EF held $970.2 million in assets — $788.7 million in crypto and $181.5 million in non-crypto. Ether made up more than 81% of the foundation’s total holdings. Since then, ETH has declined around 1.8%, according to CoinGecko data.
The EF also announced plans to generate returns from its holdings through decentralized protocols. It will focus only on audited, immutable DeFi platforms that align with the foundation’s values.
In February, EF allocated 45,000 ETH — worth $120 million at the time — to deploy across DeFi protocols. So far, it has lent ETH and borrowed $2 million worth of GHO from Aave. Other protocols, including Spark and Compound, have also received support.
Shift from Neutrality Draws Mixed Reactions
Historically, the Ethereum Foundation avoided backing specific DeFi projects to maintain neutrality. However, this policy shift has drawn both support and criticism. Infinex founder Kain Warwick recently accused the foundation of being “anti-DeFi” for its past reluctance to engage directly with DeFi builders.
Meanwhile, EF’s internal development team is also undergoing changes. On June 2, the foundation confirmed it had restructured its team, resulting in some layoffs. The exact number of affected staff was not disclosed.
The moves come as ETH continues to underperform in the current bull cycle. While Bitcoin and Solana have reached new all-time highs, ETH still trades 46.5% below its November 2021 peak of $4,878.
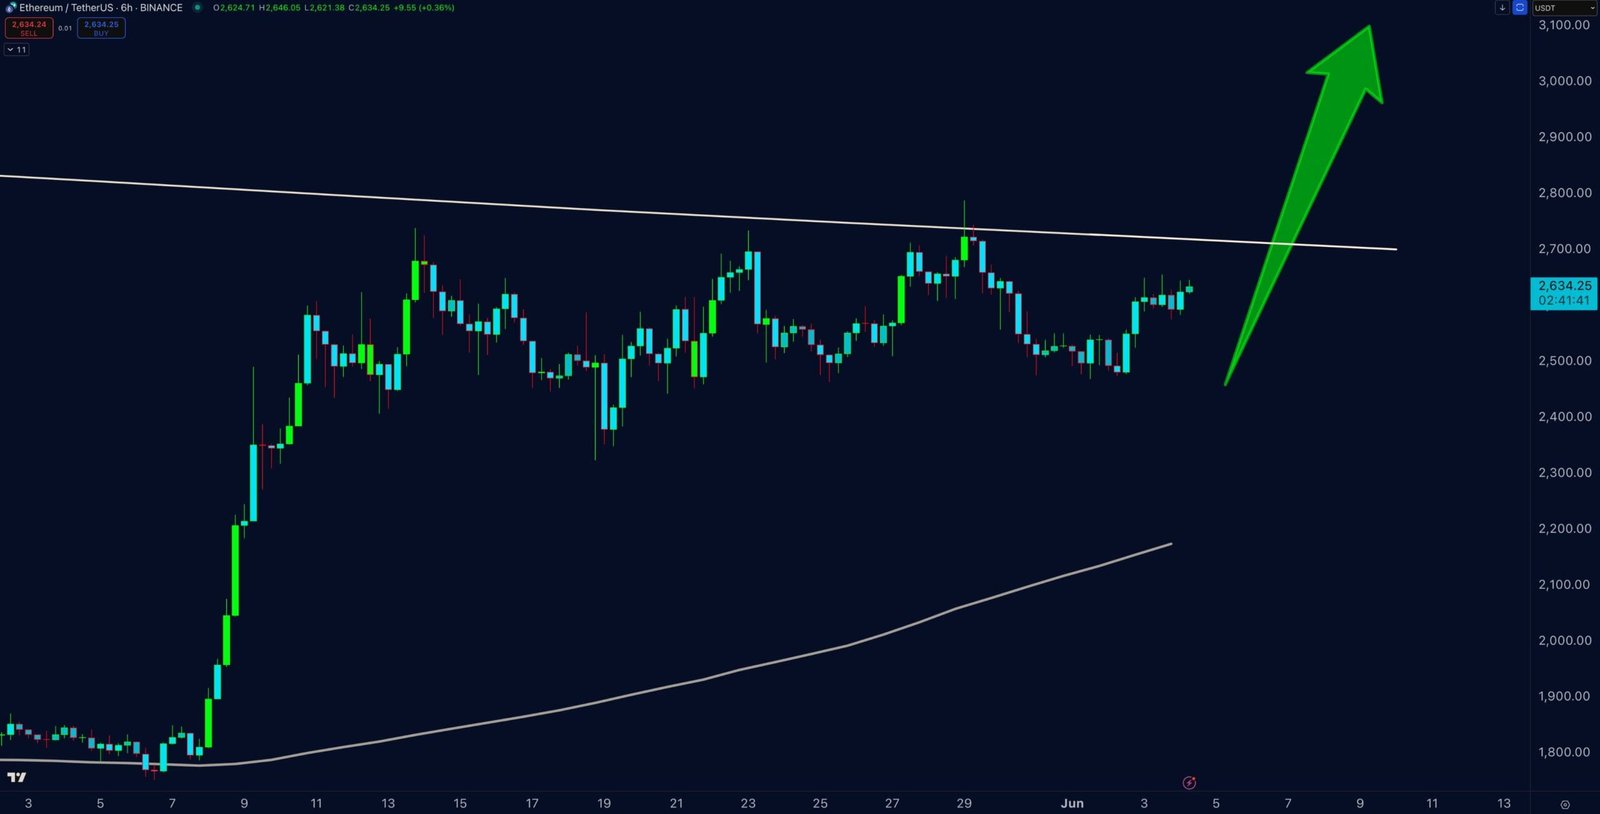
Ethereum Forms Bullish Flag, Targets 8% Rally Toward $2,845
On June 5, 2025, the Ethereum to United States Dollar (ETH/USD) pair formed a bullish flag pattern on the 1-hour chart, as published on TradingView.

A bullish flag pattern typically appears after a sharp upward price move known as the flagpole. This move is followed by a period of consolidation inside two parallel, downward-sloping trendlines. The pattern often signals a potential continuation of the prior uptrend once the price breaks above the upper boundary of the flag.
Currently, ETH/USD trades at $2,632.2, just above the 50-period Exponential Moving Average, which stands at $2,612.7. The flag structure is well defined, and volume shows a brief pause after the initial surge on June 3.
If the price breaks out above the flag’s resistance line, the bullish pattern may confirm. That confirmation would activate a projected 8% upward move, targeting approximately $2,845.6.
The chart also shows rising momentum supported by volume spikes during the initial breakout attempt. If Ethereum closes above the flag’s upper boundary with strong volume, this would validate the bullish flag and increase the probability of hitting the $2,845 zone.
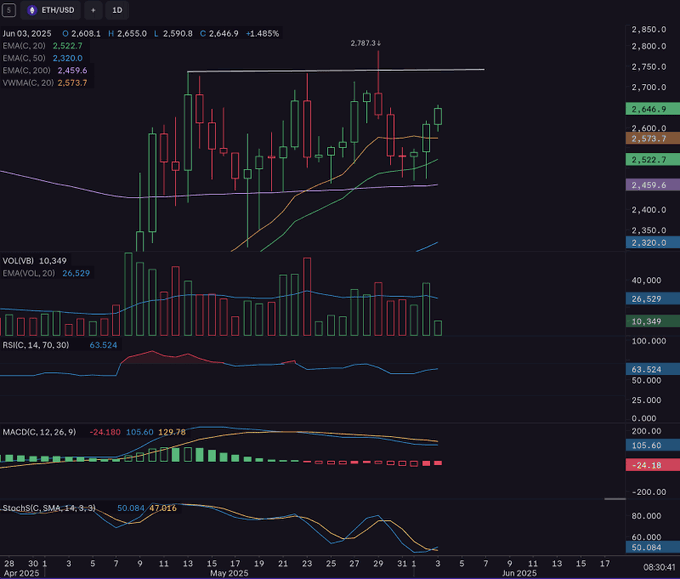
Ethereum SMI Turns Up from Oversold Zone, Hints at Short-Term Bounce
On June 5, 2025, the Stochastic Momentum Index (SMI) for Ethereum began to reverse from the oversold region, suggesting a possible short-term price rebound.
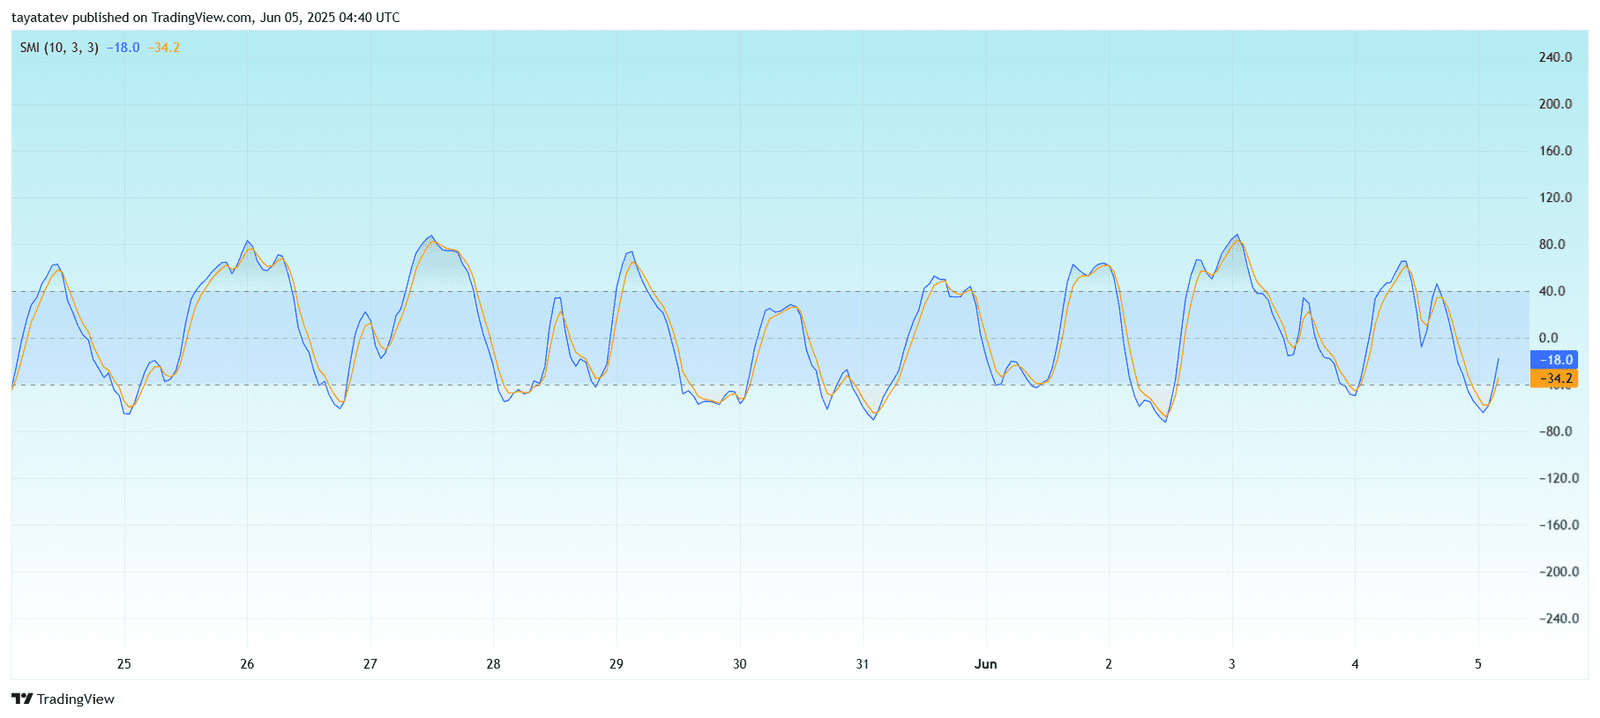
The SMI chart shows the blue line (SMI value) at –18.0 and the orange signal line at –34.2, both climbing upward after dipping below the –40 zone. When the SMI crosses above its signal line from oversold territory, it often signals growing bullish momentum.
Previously, similar crossovers on May 26, May 30, and June 2 led to local price increases. If this pattern holds, Ethereum may see a continuation of the upward move already visible on the price chart.
This shift in momentum aligns with the bullish flag structure on the 1-hour price chart. Together, both indicators support the idea of a breakout attempt toward the $2,845 zone, as long as buying pressure continues to rise.
Ethereum RSI Holds Above 50, Shows Strength Ahead of Breakout
On June 5, 2025, the 14-period Relative Strength Index (RSI) for Ethereum stood at 54.45, slightly above its signal line at 50.93. This upward crossover signals building momentum.

The RSI curve bounced after dipping near the neutral 50 level, which often acts as dynamic support in uptrends. When the RSI holds above 50, it suggests bullish control remains intact.
The last time RSI crossed above its moving average from this zone, on June 2, Ethereum followed with a price rally. Now, this crossover may help fuel the potential breakout above the bullish flag structure seen on the 1-hour chart.
If RSI continues climbing and stays above 60, it may confirm accelerating buying pressure, reinforcing the 8 percent price target toward the $2,845 resistance level.
