
Tidal Trust II submitted a filing to the U.S. Securities and Exchange Commission on August 19 to add two new cryptocurrency exchange-traded funds. The proposed funds are the Defiance Leveraged Long + Income XRP ETF and the Defiance Leveraged Long + Income SOL ETF, according to the Form N-1A post-effective amendment.
The funds aim to provide leveraged long exposure to XRP and Solana while incorporating an income component. Leveraged long ETFs amplify returns on daily price movements, but also carry heightened risk of losses. The filing describes these products as part of the “Defiance Leveraged Long + Income” series, which already covers equities such as Apple, Amazon, Nvidia, and Tesla.
The move signals another step by ETF issuers to expand crypto-related investment products in the U.S. market. Earlier filings under Tidal Trust II focused on technology and growth stocks, while this amendment marks one of the first attempts to apply the structure to major digital assets.
The funds remain pending and require SEC review before approval or listing. No launch date has been disclosed. The amendment was filed under the 1933 Securities Act and the 1940 Investment Company Act, with The Corporation Trust Company in Delaware named as the agent for service.
XRP Flashes Buy Signal on Hourly Chart
XRP’s price action shows a potential rebound signal after the TD Sequential indicator printed a buy setup on the hourly chart, according to market analyst Ali (@ali_charts). The tool signaled exhaustion following a series of bearish candles, with XRP consolidating around the $2.91 level on Binance’s perpetual futures contract.
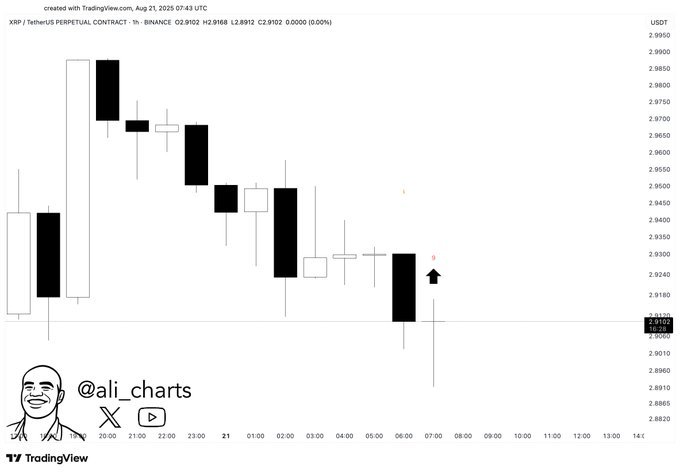
The indicator has previously marked local reversals by identifying points of trend exhaustion. The latest signal suggests downward momentum may be easing, raising the possibility of a short-term recovery. At the time of the signal, XRP traded between $2.89 and $2.92, just above intraday lows near $2.88.
Analysts track the TD Sequential closely because of its history of pinpointing trend shifts. The current setup adds weight to expectations that XRP could stabilize or attempt a bounce after recent weakness.
XRP Falling Wedge on four hour chart, 78 percent upside if confirmed
The TradingView chart was created on August 21, 2025 . It shows XRP/ USD on Bitstamp, four hour timeframe. At the timestamp, price sat near 2.90073 dollars. The fifty period exponential moving average stood around 3.03007 dollars.
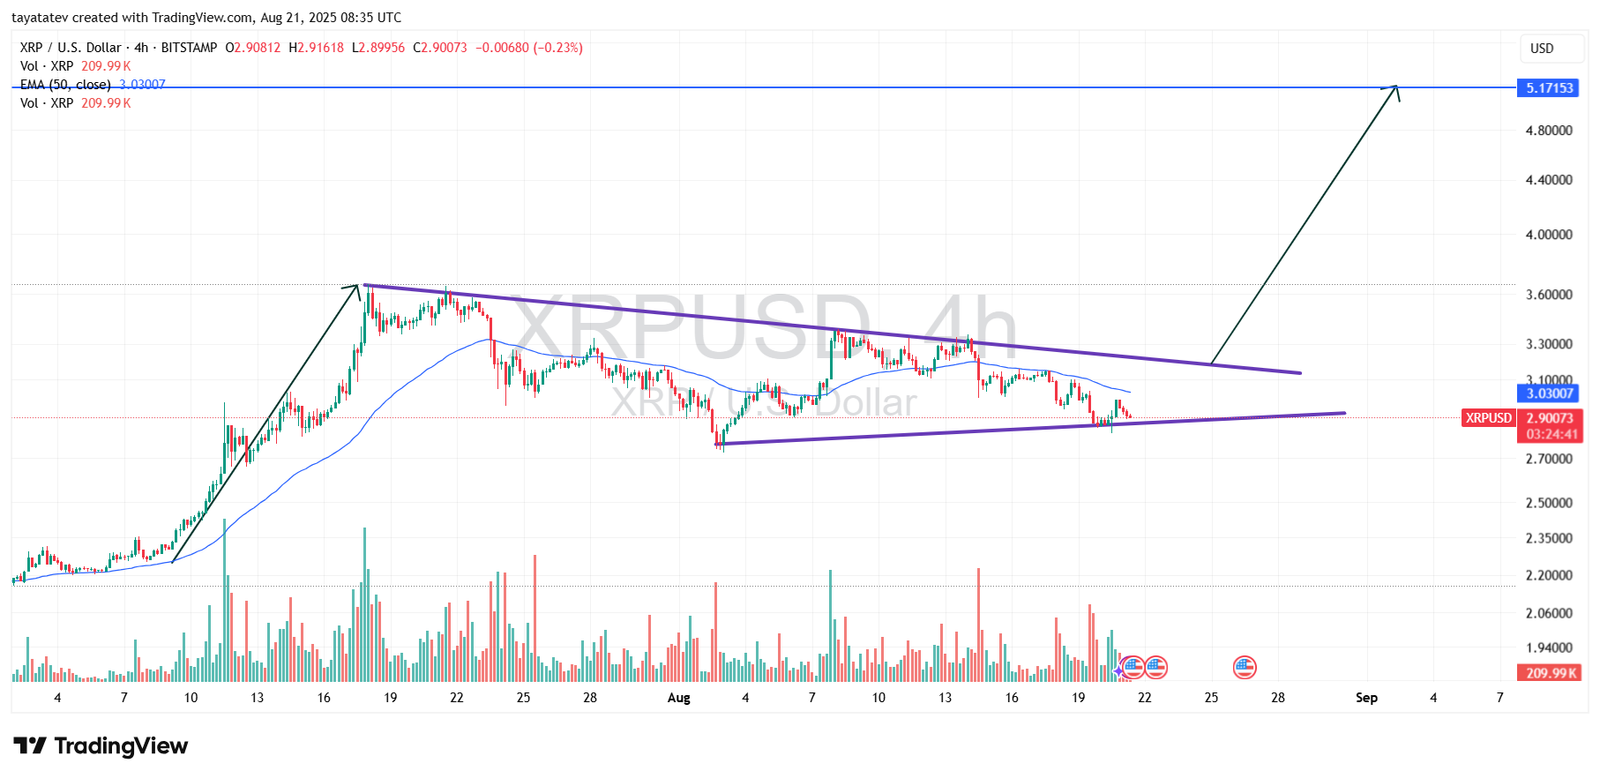
A falling wedge is a bullish reversal pattern where two downward sloping, converging lines signal waning selling pressure and a possible break higher.
Price has tracked a descending resistance line from recent highs while holding a gently rising support line near 2.88 to 2.90 dollars. It trades just below the exponential moving average, which often acts as a near term pivot. A decisive four hour close above the wedge top, ideally with stronger volume, would mark confirmation of the breakout.
If confirmed, the charted objective implies about seventy eight percent from the shown price. That projects to roughly 5.16 dollars, in line with the illustrated target near 5.17153 dollars. A sustained close beneath wedge support would invalidate the setup and delay any recovery.
XRP Relative Strength Index Points to Weak Momentum
The TradingView chart created on August 21, 2025 at 08:44 Coordinated Universal Time shows the Relative Strength Index (RSI) with a 14-period setting, closing basis. The RSI line is plotted in purple, while the signal line, often used as a moving average of RSI, appears in yellow. At the time of the snapshot, RSI stood at 40.89, and the signal line was slightly lower at 38.61.
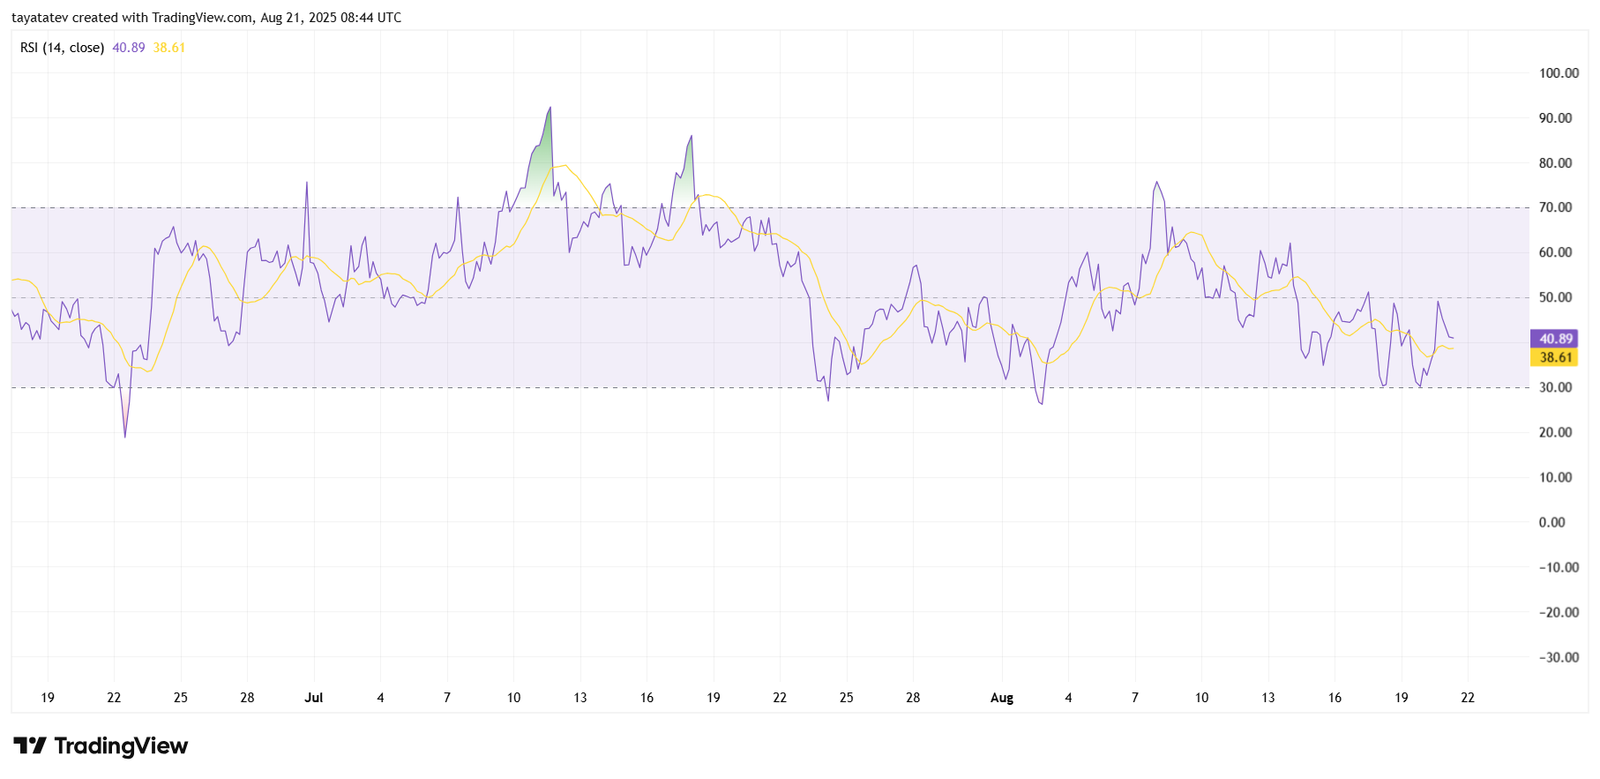
The indicator has traded largely between 30 and 70, the standard range that separates oversold from overbought conditions. Dips below 30 usually highlight potential undervaluation, while moves above 70 often indicate stretched conditions. In this chart, XRP’s RSI shows repeated rejections near 60 to 65, pointing to limited bullish momentum during recent recoveries.
Currently, the RSI remains closer to the lower half of the range, signaling weak buying pressure. The recent crossover where the RSI trades above the signal line suggests a mild attempt to stabilize. However, the reading still reflects subdued strength, leaving room for further downside tests unless price action sparks stronger inflows.
This setup means XRP is not oversold but continues to hover in a neutral-to-bearish zone. A decisive bounce in RSI above 50 would mark renewed momentum, while a drop closer to 30 would warn of extended weakness.
XRP Directional Movement Index Signals Weak Trend
The TradingView chart created on August 21, 2025 at 08:48 Coordinated Universal Time shows the Directional Movement Index (DMI) with a 14-period setting. The chart plots three key lines: the positive directional indicator (+DI, orange), the negative directional indicator (–DI, red), and the average directional index (ADX, blue). At the snapshot, +DI was at 30.36, –DI at 30.31, and ADX at 13.91.
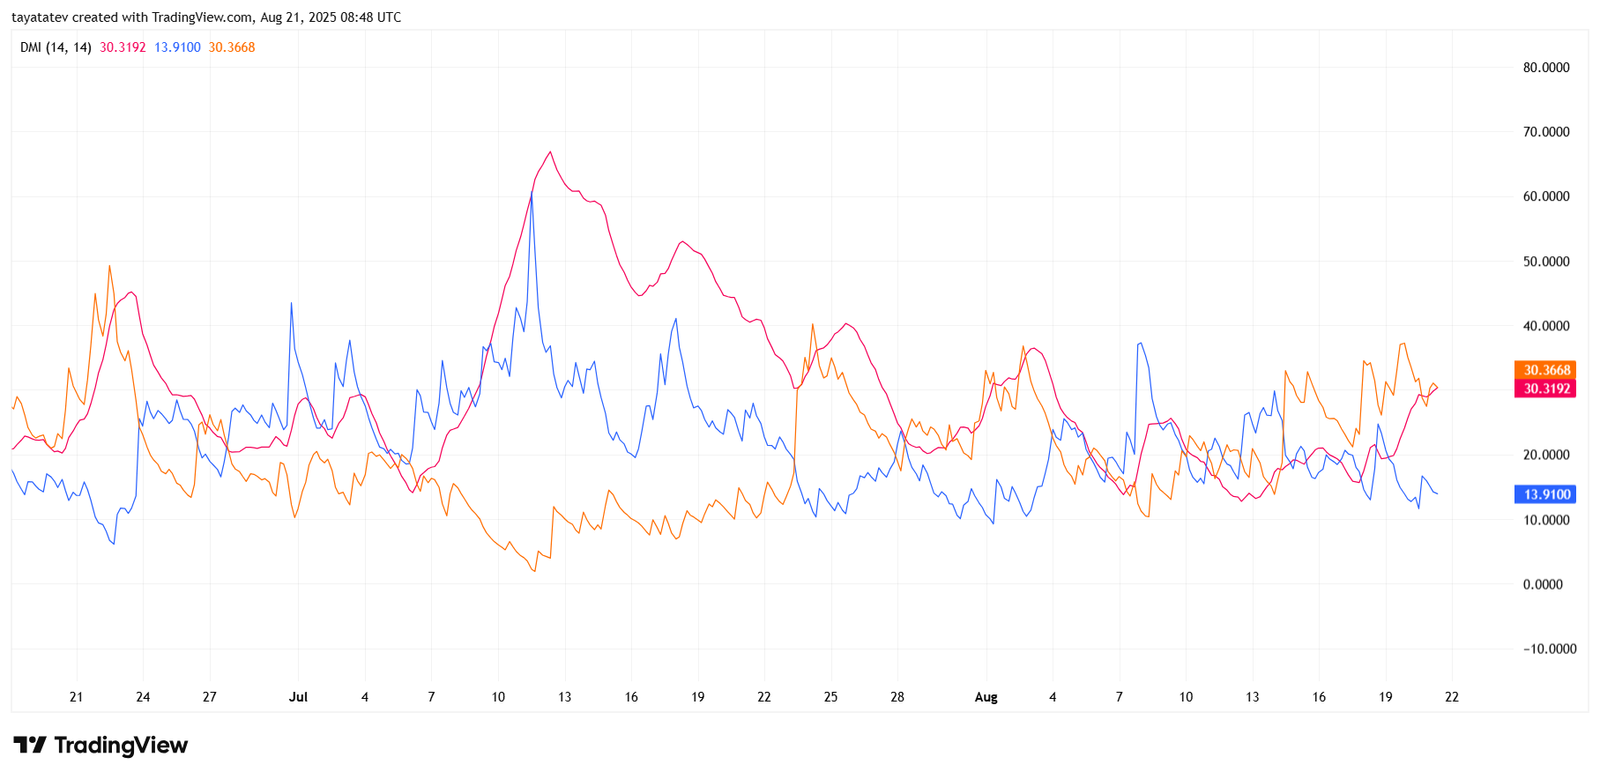
When +DI trades above –DI, it reflects upward pressure, while the reverse signals selling momentum. Currently, +DI and –DI are almost equal, showing no clear directional dominance. This balance points to indecision between buyers and sellers. Meanwhile, ADX at 13.91 remains far below the 25 threshold that typically signals a strong trend, confirming that XRP is in a weak trend phase with limited conviction on either side.
The near overlap of +DI and –DI indicates short-term choppiness rather than a clear bullish or bearish breakout. Unless ADX rises alongside a widening gap between the directional indicators, XRP’s price is likely to continue consolidating without strong momentum.
