Solana extended its rally on August 24, crossing the $200 threshold and testing resistance between $206 and $210. The token climbed to an intraday high of $207.45, marking an 11 percent jump in 24 hours. Its performance outpaced both Bitcoin and Ethereum, cementing Solana as one of the strongest movers among major cryptocurrencies. Analysts attribute the surge to rising institutional demand, whale accumulation, and network improvements that have bolstered sentiment.
The recent advance puts Solana directly against a critical resistance zone that has capped rallies in July and August. Technical SOL/USDT charts highlight a triple top pattern forming at these levels, with price struggling to sustain a breakout. A decisive close above $210 would invalidate the pattern and open the path toward higher ranges. Traders note that such a breakout could set up a measured move toward $218 and potentially $228, as momentum indicators point to continued buying pressure.
Whale Activity and Market Structure
On-chain data confirms a sharp rise in whale transactions and buyback activity, increasing by more than 150 percent in recent sessions. The influx of large buyers has added strength to Solana’s price action, while liquidity across exchanges has improved. This accumulation phase has reduced volatility during pullbacks and reinforced confidence among institutional participants.
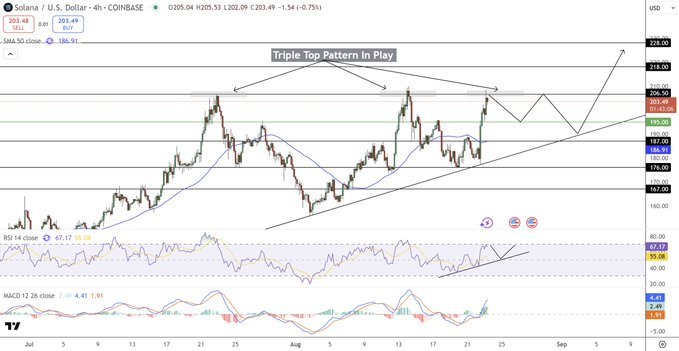
Despite the strong inflows, traders remain cautious of the triple top structure, as repeated failures at the same resistance often signal short-term exhaustion. However, the broader ascending channel visible on the four-hour chart provides a bullish structure, with higher lows reinforcing the uptrend. Support levels now stand at $195 and $187, areas that could absorb selling pressure if rejection occurs at $210.
Technical Indicators Signal Momentum
Momentum oscillators underline the strength of the move. The Relative Strength Index (RSI) continues to trend higher, holding above 60 with room before reaching overbought territory. The MACD indicator also shows a bullish crossover, supporting expectations of further upside if resistance breaks.
Market observers emphasize that a clean breakout above $210 would confirm Solana’s momentum and shift focus to the $218–$228 region, with a potential extension toward $250 if buying accelerates. In contrast, rejection could trigger a retest of $195, though the prevailing uptrend suggests dips may attract renewed demand.
Whale Activity and Buybacks Drive Sentiment
Data from on-chain trackers show whale activity on Solana rising sharply in recent days. Large wallet addresses increased both transactions and buybacks, with the overall volume climbing by 158 percent. The surge in activity has reinforced bullish sentiment in the market, with investors interpreting these moves as signs of confidence in Solana’s long-term trajectory.
At the same time, liquidity across trading platforms has improved as institutional players expanded exposure to the token. The higher participation rate has provided price stability during periods of volatility and has contributed to sustained upward momentum. This environment has made Solana one of the strongest performers in August, cementing its position among top digital assets by market capitalization.
VanEck Files for Solana Staking ETF
Adding to the momentum, asset management firm VanEck filed for the first-ever JitoSOL exchange-traded fund (ETF), built on the Solana blockchain. The proposed fund aims to provide investors with regulated access to staking rewards generated through JitoSOL, a liquid staking derivative. If approved, the ETF would allow market participants to capture yield directly within brokerage accounts without needing to interact with decentralized protocols.
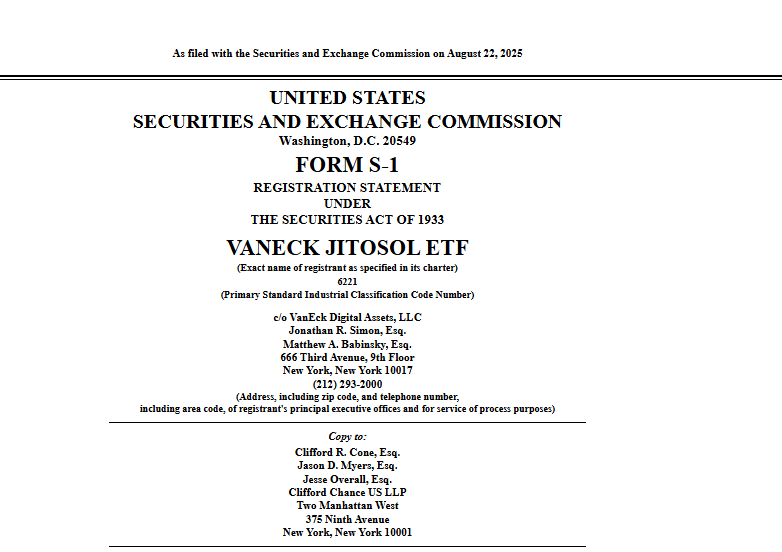
Industry analysts view the filing as a milestone for Solana, as it signals institutional recognition of the network’s staking ecosystem. The development follows similar products linked to Ethereum and Bitcoin, but marks the first significant attempt to create an ETF tied specifically to Solana’s infrastructure. Market participants expect the move to expand access to staking yields while reinforcing Solana’s credibility in traditional finance circles.
Solana’s Seasonal Price Performance
The chart compares Solana’s yearly price movements from 2023 through 2025, highlighting clear differences in momentum. In 2023, the token posted extraordinary gains of more than 900 percent, with the bulk of the rally arriving in the final quarter of the year.
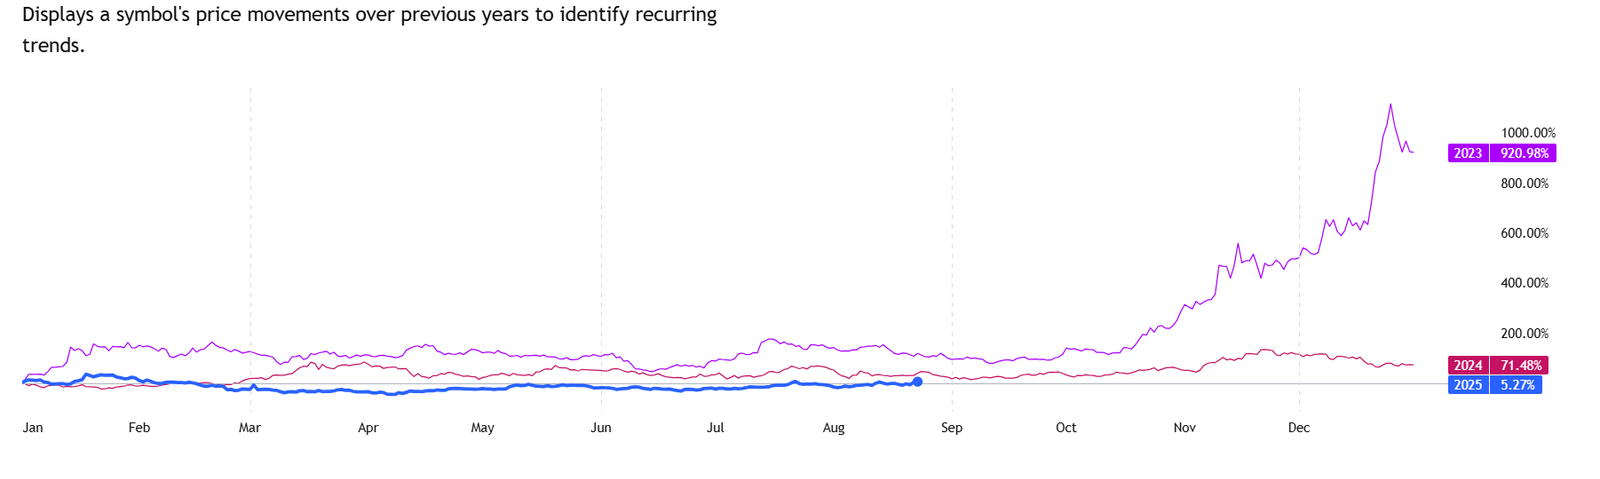
This period of parabolic growth contrasts sharply with 2024, when Solana advanced about 71 percent, showing steadier progress that peaked midyear before flattening into year-end. By 2025, performance has been far more restrained, with only a 5 percent gain recorded so far, suggesting a consolidation phase following two years of strength.
The pattern underscores Solana’s tendency to generate outsized moves late in the year, pointing to a seasonal trend where Q4 historically drives significant returns. This backdrop now places attention on whether Solana will repeat its late-year momentum in 2025 as it consolidates near resistance levels around $210.
Technical Outlook Signals Higher Levels
From a technical perspective, Solana remains positioned for further gains. The token currently trades near $204, consolidating after its double-digit surge earlier this week. Charts indicate that a decisive breakout above $210 could serve as a catalyst for a new rally, targeting resistance levels at $228 and $250. Momentum indicators, including the Relative Strength Index, suggest continued buying pressure, while moving averages confirm a strong uptrend.
The combination of whale-driven demand, institutional participation, and ETF developments provides a supportive backdrop for Solana’s current rally. As trading volumes increase and liquidity deepens, market participants will continue to watch for whether the token can sustain momentum and hold above its critical support levels.
