
Key Chainlink takeaways:
- Chainlink made a 40% headway since June 22 crash. CryptoRand sees the price going to the three estimated targets
- 4h chart confirms the bullish bias with LINK’s breakout from the symmetrical triangle formation
YEREVAN (CoinChapter.com) — LINK, Chainlink’s decentralized oracle network’s native token, has maintained an overall bullish momentum since the crash on June 22. The token gained 40 percent since then, hitting $20.8 during the London session Wednesday.
CryptoRand, an independent market analyst, predicted that LINK would continue its bull run. In a tweet published on July 6, the chartist plotted all the major resistances and supports of the recent sessions (dotted lines). That included both horizontal trendlines and slopes.
He then drew out three possible target prices for LINK to hit in the sessions ahead. The three targets stand at crucial support/resistance lines at $23.5, $27.0, and $32.5.
The daily chart presented by the analyst shows the recent support trendline that prevented the token from sliding south. However, after taking a closer look at the four-hour chart, the mentioned trendline becomes prominent as a part of a symmetrical triangle formation.
Related: Chainlink chokes bearish outlook despite LINK crashing over 12% intraday
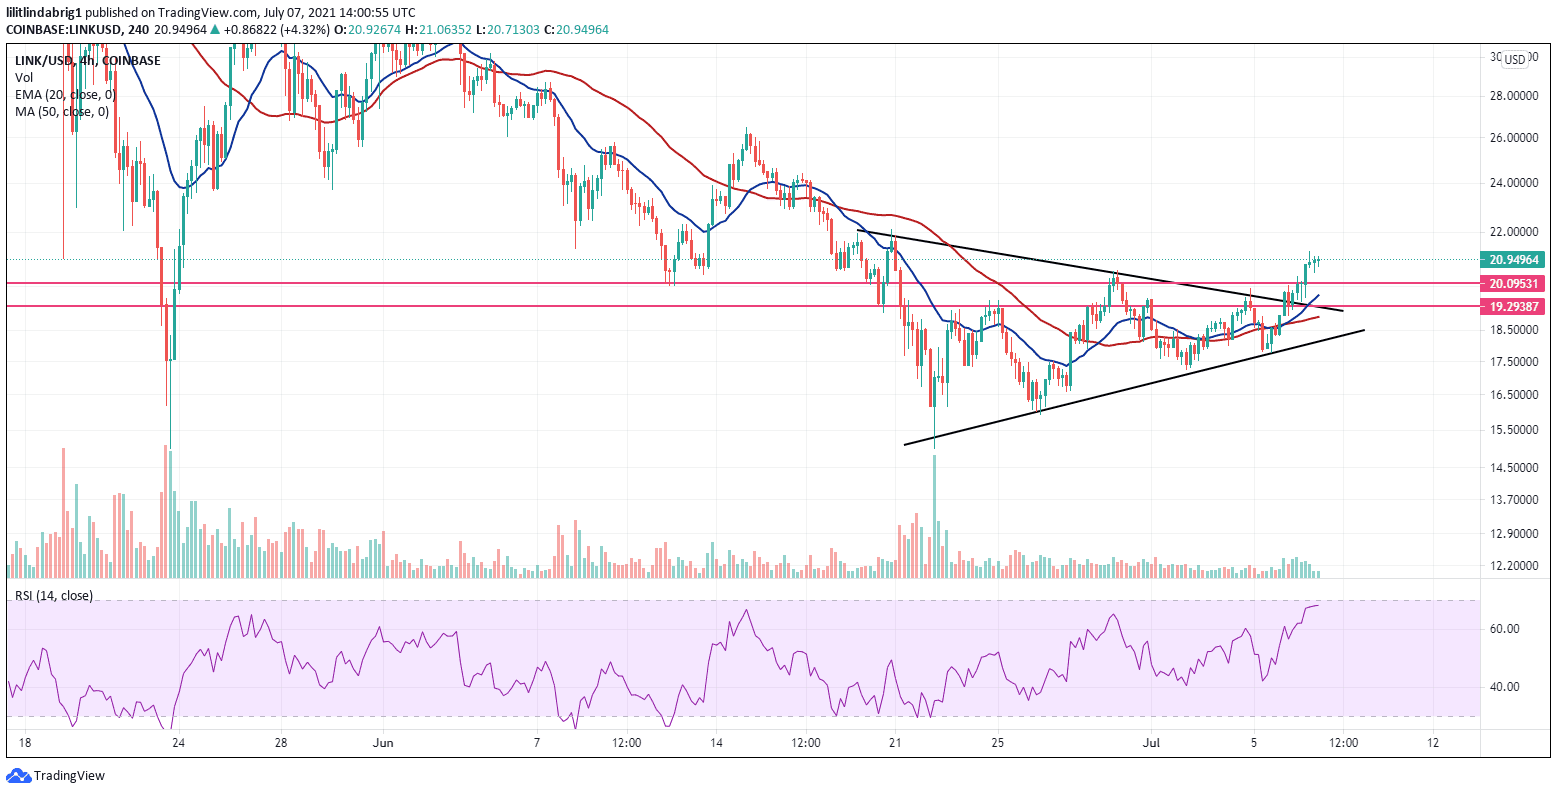
Four-hour chart
The symmetrical triangle consists of two converging trendlines with a similar slope. The triangle limits the token’s price fluctuations within the trendline. After Chainlink exhausted the pattern, it flourished and gained 5.5 percent since it left the formation on July 6.
CryptoRand’s first price target of $23.5 is still quite far. However, given the strong momentum, LINK could reach it in the sessions ahead.
Moreover, Chainlink scored a golden cross on the four-hour charts on July 6. The 20-4h exponential moving average (EMA-20; blue wave on the chart above) crossed above the 50-4h simple moving average(SMA-50; red wave) with a confident uptrend. Thus, the golden cross is a solid bullish predictor.
If LINK fails to continue the uptrend, it has two support levels to retest at $19.2 and $20.0.
The Relative Strength Index (RSI) went as high as 68 before correcting its trajectory sideways. The RSI reflects the perception of the adequacy of a token’s price based on the overall momentum. When the indicator flies above the ‘normal’ 30-70 range, traders could consider the coin overbought and withdraw their assets, sending the price down.
Related: Ethereum crowd fumed over delayed London fork as ETH crosses $2.4K
Analyst CryptoRand sees Chainlink’s price reaching $23.5 as the initial target, then possibly climbing to $27.0 and $32.5. LINK’s golden cross and the breakout of the symmetrical triangle support the bullish outlook. However, if the prediction doesn’t pan out, the token could rely on several support lines for assistance.

… [Trackback]
[…] Find More Info here on that Topic: coinchapter.com/chainlink-churns-40-gains-in-two-weeks-analyst-sees-a-link-boom-ahead/ […]
… [Trackback]
[…] There you will find 33151 additional Information to that Topic: coinchapter.com/chainlink-churns-40-gains-in-two-weeks-analyst-sees-a-link-boom-ahead/ […]
… [Trackback]
[…] Information to that Topic: coinchapter.com/chainlink-churns-40-gains-in-two-weeks-analyst-sees-a-link-boom-ahead/ […]
… [Trackback]
[…] Find More to that Topic: coinchapter.com/chainlink-churns-40-gains-in-two-weeks-analyst-sees-a-link-boom-ahead/ […]
… [Trackback]
[…] Find More to that Topic: coinchapter.com/chainlink-churns-40-gains-in-two-weeks-analyst-sees-a-link-boom-ahead/ […]