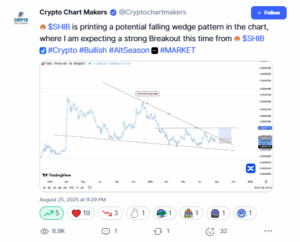
A trader pointed out that Shiba Inu (SHIB) is shaping a falling wedge on its daily chart — a pattern that often ends with a sharp move higher. The analyst suggested a breakout could be around the corner if SHIB manages to close above its downward sloping trendline.
The timing of this call is striking. According to Shibburn, SHIB’s burn rate has collapsed by over 95% in the last 24 hours, with just under 170,000 tokens destroyed. On most active days, millions are typically burned. That means the supply-reduction story, one of SHIB’s long-term bullish drivers, looks weak right now.
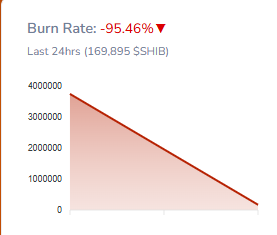
So, while traders are talking up the possibility of a rally, the underlying supply pressure that usually supports such moves is fading.
Shiba Inu Burn Collapse and Weak Network Use Cast Doubt
SHIB currently trades near $0.0000122, clinging to a support area that has held through several retests this month. This level is crucial: it’s where buyers have stepped in to prevent deeper losses.
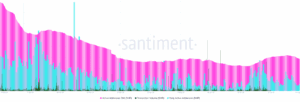
But beyond burns, network activity remains muted. Data from Santiment shows daily active addresses trending lower compared to earlier this year. In simple terms, fewer wallets are sending and receiving SHIB. That usually signals less user participation in the network — never a healthy sign for sustained rallies.
Derivatives markets also show hesitation. Coinglass data shows that open interest in SHIB futures has been sliding, while funding rates are flat to slightly negative. It means that leveraged traders are not piling into bullish bets. In fact, some are leaning short.
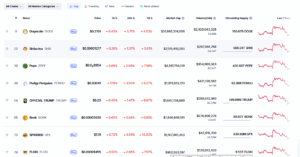
Zooming out, the entire meme coin sector has been under pressure. Dogecoin, Pepe, Bonk, and Floki have all posted losses over the past week. That makes it tougher for SHIB to move against the tide.
Breakout Above $0.000014 Could Flip Sentiment
On the daily price chart, SHIB is sitting just above a key support zone near $0.000012. This level has been tested multiple times in August and has held so far. If SHIB price slips below this area, the bullish wedge story weakens quickly. On the upside, the first test is the downward trendline, followed by the 100-day exponential moving average at $0.0000129 and the 200-day EMA at $0.0000141. Clearing these levels would be an important signal that buyers are regaining control.
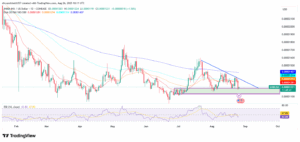
The Relative Strength Index (RSI) is around 44, which means momentum is weak but not yet oversold. Oversold conditions, usually below 30, sometimes trigger rebounds. For now, RSI shows that SHIB is under pressure but not at a point of extreme exhaustion.
If SHIB can push through the wedge and close above resistance, the next likely target is the 200-day EMA around $0.000014. That would mark about a 15% move from current prices. But if the $0.000012 support breaks, the price could revisit July lows near $0.0000115. A drop below that would signal that the breakout call has failed, and bears remain in control.
