Sei (SEI) traded near $0.29 after weeks of muted action, leaving traders searching for a breakout trigger. Analysts argued that buying SEI at current levels looked similar to buying Sui (SUI) before its explosive rally earlier this year. The SEI price mirroring SUI’s rally could theoretically see the token reach a price tag near $2.
Chart watchers highlighted how SEI mirrored SUI’s structure, fueling speculation that the token could follow the same trajectory. The comparisons placed SEI at a critical juncture, with sentiment shifting toward whether it could replicate SUI’s upside momentum.
Analysts Frame SEI as SUI’s Earlier Self
Analysts noted that SEI’s chart structure resembled the setup that preceded SUI’s surge.
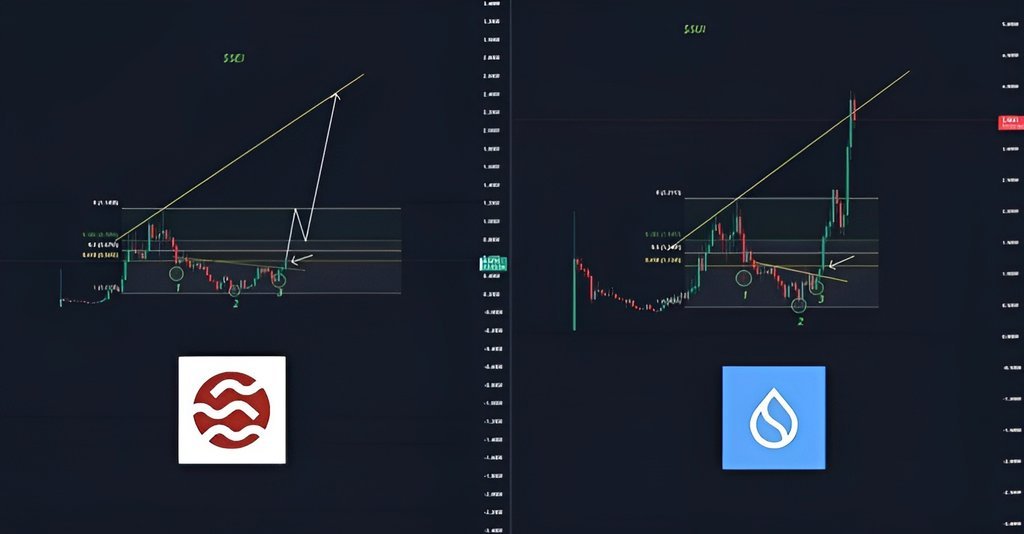
Independent analyst SeiWizard has highlighted the similarity in an X post, arguing that SEI at $0.29 mirrored SUI at $0.48 before its rally. The charts show accumulation phases and Fibonacci retracements lining up almost identically, with the token forming a base that traders believed could support an upward breakout. The comparison has gained traction as both assets appeared to follow near-parallel fractals.
If SeiWizard’s prediction holds, the token’s price might see a 620% spike, if only on paper.
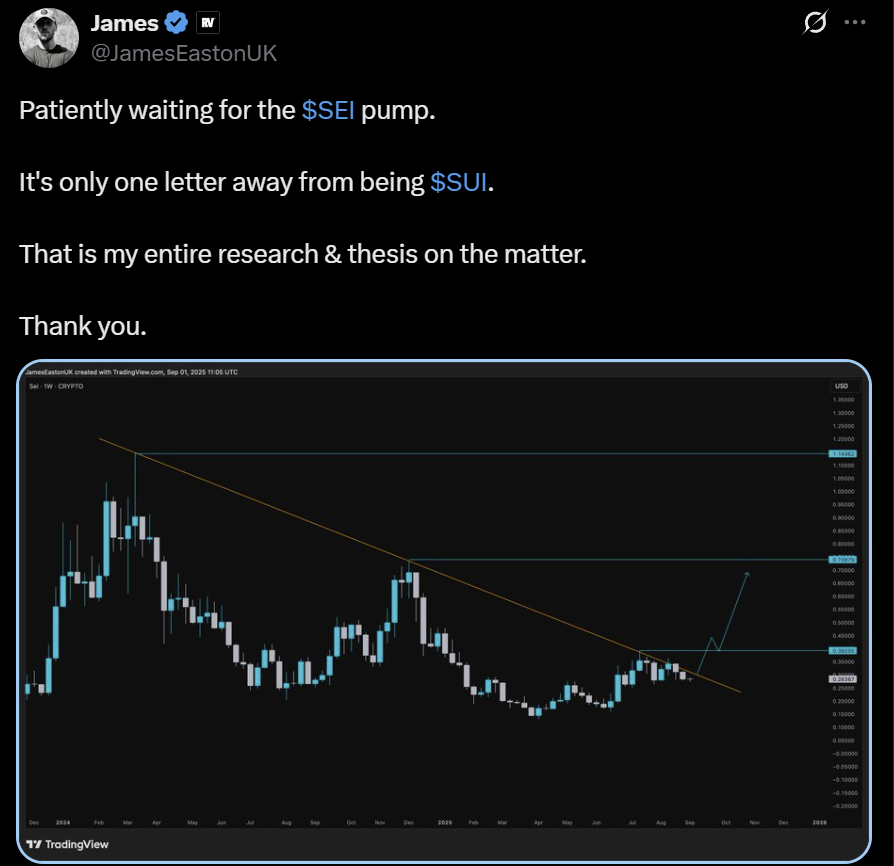
Moreover, James Easton has added a separate projection. His weekly SEI chart shows the token attempting to break its descending trendline. Easton’s roadmap targets $0.45, then $0.74, and eventually $1.14 if momentum continues. The visual suggests a staged breakout, with each level marking a potential checkpoint. The approach echoed how SUI’s recovery unfolded, reinforcing the claim that SEI might be walking the same path.
Market observers have also pointed out how SEI’s price action is compressed within a consolidation box. That pattern often precedes stronger moves, especially when combined with oversold sentiment and tightening ranges. The posts argue that such conditions might have created an attractive setup for accumulation.
Some have also stressed that SEI’s broader ecosystem growth, including rising developer activity and early liquidity support, provide a backdrop similar to SUI’s launch stage.
The narrative places SEI at a pivotal point.
Analysts Tied Breakout Prospects to ETF Speculation
The comparison to SUI has gained further weight as other analysts have echoed bullish setups on SEI.
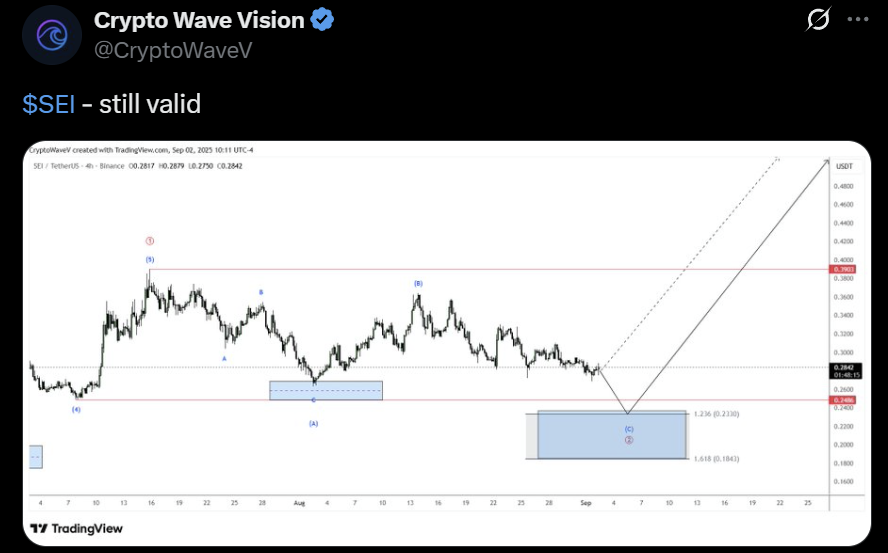
Crypto Wave Vision has argued that SEI’s corrective wave count remains intact. The analyst’s chart places support near $0.24, where the final leg of a C wave could complete. He has projected a sharp rebound toward $0.39, framing the structure as a valid setup for a new advance towards $0.48. The view stresses that weakness has not broken the bullish roadmap.
Moreover, independent analyst Nick has expanded the technical case with a broader perspective.
Crypto analyst Nick has noted that the token presses against major long-term resistance, where a breakout appears imminent. His focus has shifted to the potential role of a 21Shares ETF application, calling it a possible driver of fresh demand. The analyst has targeted $1.76 using Fibonacci extensions, describing it as a sixfold rise if momentum carries. His analysis has linked structural resistance with external catalysts, making the case for upside continuation.
Fibonacci checkpoints at $0.51, $0.75, and $0.92 have marked potential stages of confirmation. Nick has suggested that each flip would confirm strength and reduce downside risks. The roadmap highlights a gradual but convincing breakout structure, not an instant surge.
The ETF narrative adds credibility. 21Shares has filed an S-1 with the SEC to launch an SEI ETF, designed to track the CF SEI-Dollar Reference Rate. Coinbase Custody was named as custodian. The filing also leaves room for staking, pending legal clearance. While the news was not new, it has reinforced analysts’ views that institutional frameworks could support the token’s rally if the breakout is confirmed.
