Cardano (ADA) trades at $0.80, but analyst Ali Martinez expects it to fall further to $0.69 before rebounding toward $2. He calls this level the “best buy zone” for long-term investors. But do Cardano’s fundamentals, onchain data, and technical indicators support that view? Let’s find out.
Pattern Suggests Brief Pullback Ahead of Breakout
Ali Martinez shared a chart showing Cardano forming a symmetrical triangle pattern, a technical setup that often signals a large breakout after an extended consolidation. He expects ADA price to retest $0.69, a level that has acted as strong support several times this year, before a potential move toward $1.20 and eventually $2.00.
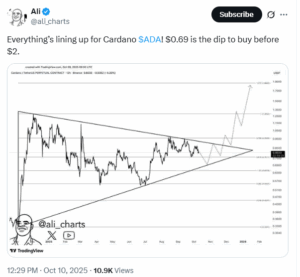
According to Ali, this dip would complete Cardano’s consolidation phase, allowing the price to regain upward momentum once buying pressure returns. His projection is based on price compression within the triangle and the assumption that the lower support band will hold. However, whether this scenario plays out depends not only on technical factors but also on network usage and derivatives activity.
Cardano Ecosystem and On-Chain Data Show Weak User Activity
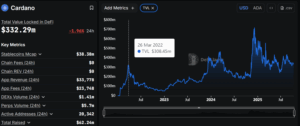
Cardano’s on-chain activity has slowed in recent months. Data from DeFiLlama shows the total value locked (TVL) at around $332 million, down nearly 50% from its 2025 peak. The number of daily active addresses sits near 20,000, which shows stable but weak engagement compared with the network’s 2021–2022 cycle.
Cardano founder Charles Hoskinson has acknowledged the ecosystem’s lag in DeFi growth. Speaking at Token2049 Singapore, he said Cardano’s current challenge is attracting more liquidity and developer participation. To address this, he outlined plans to integrate Bitcoin and XRP liquidity into Cardano, arguing that cross-chain capital could help raise TVL to between $10 billion and $15 billion over time.
Despite these efforts, current data shows Cardano’s on-chain demand remains muted. While network upgrades have improved functionality, they have not yet produced a visible rise in user activity or DeFi inflows.
Additionally, ADA’s open interest is gradually increasing, recovering after months of low activity. This indicates traders are re-entering the market, positioning for volatility but without a clear directional bias.
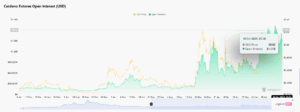
At the same time, funding rates remain between 0.01% and slightly negative, showing neutral to mildly bearish sentiment. There is no strong dominance of long or short positions.
This combination — rising open interest and flat-to-negative funding — often precedes major price swings as both sides build exposure before volatility returns. However, it does not yet confirm a bullish setup. Market conviction remains limited, which supports Ali Martinez’s view that ADA could revisit lower support before attempting a rebound.
ADA Technical Setup Hint at a Retest Before a Rally
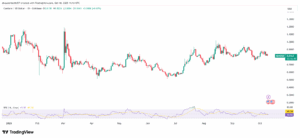
Cardano (ADA) trades at $0.8174, consolidating within a narrow range between $0.80 and $0.85 after several sessions of low volatility.
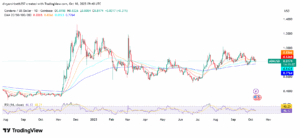
The Exponential Moving Averages (EMAs) indicate a neutral-to-slightly bearish setup: The 20-day and 50-day EMAs are nearly flat and overlapping, showing weak short-term momentum. The 100-day and 200-day EMAs form a long-term support band, with ADA trading slightly above both — suggesting an underlying but fragile bullish structure.
The Relative Strength Index (RSI) stands at 46, signaling neutral momentum. Price action remains confined within a broad symmetrical triangle, with strong support around $0.69 and resistance near $0.90.
If ADA fails to hold above $0.80, it could retest $0.69, aligning with the 0.618 Fibonacci retracement zone from the late-2024 rally — a historically strong accumulation level. A rebound from this zone could propel ADA toward $0.90, followed by $1.20 and $1.50–$2.00 if buying volume increases.
A daily close above $0.85 would signal renewed bullish strength, while a close below $0.69 would expose ADA to further downside, potentially toward $0.60.
