

NEW DELHI (CoinChapter.com) — Smart contract blockchain platform Fantom enjoyed 151% price gains in 2023, riding the wider crypto market recovery. Furthermore, FTM price rally helped the Fantom token break out from and confirmed a bullish technical pattern called the Falling Wedge.
In detail, Falling Wedges are bullish reversal patterns that begin wide at the top, but contract as the price moves lower, forming a sequence of reaction highs and lows until they converge. The structure realizes an upside bias after the price breaks out above its resistance trendline, accompanied by higher volumes.
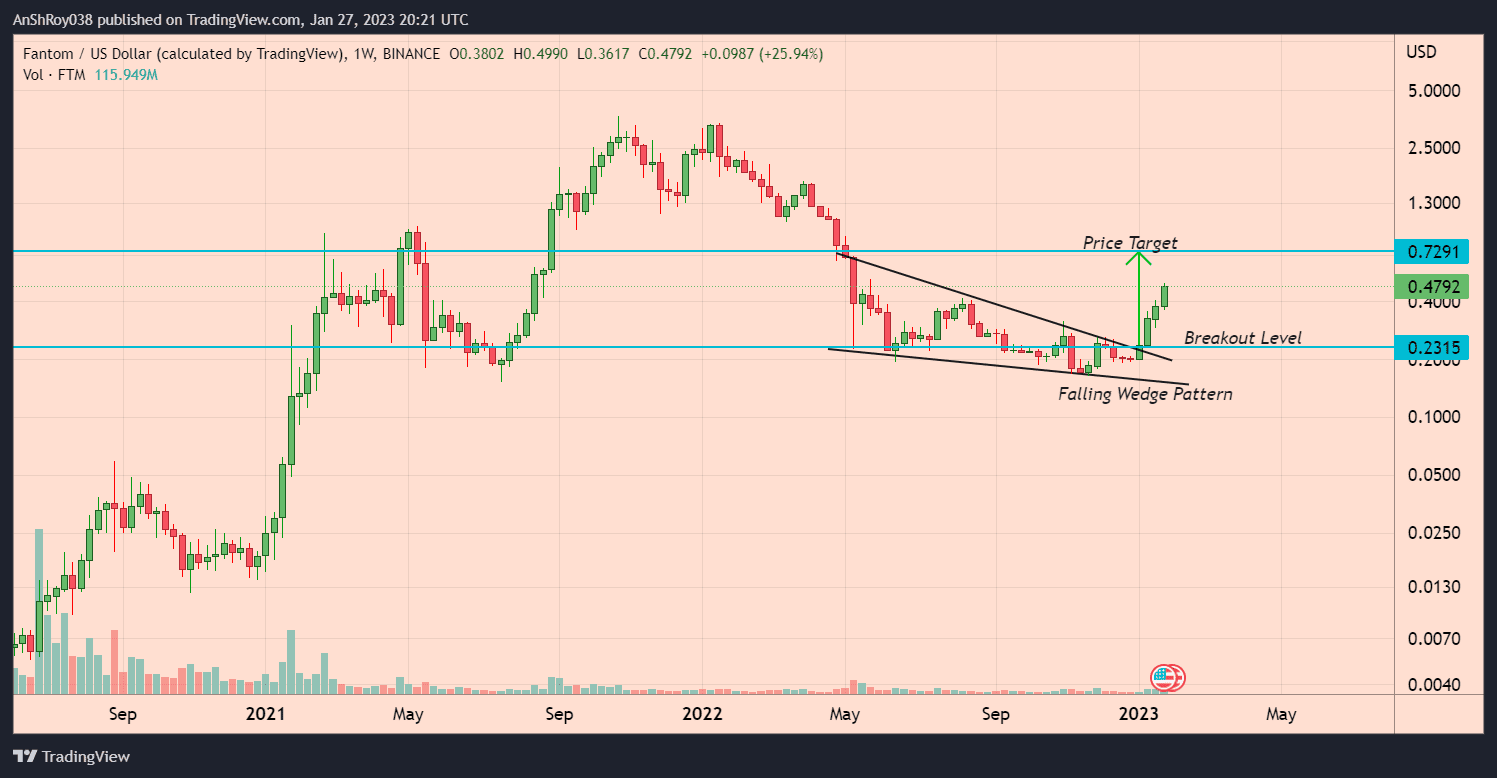
One key feature of the pattern is that volumes usually decline as the trendlines converge, with breakout confirmed at high volumes. The upside target for the breakout is equal to the maximum distance between the falling wedge’s upper and lower trendlines.
Also Read: AAVE and MATIC near key resistance – a bullish break ahead?Hence, FTM price might jump to $0.729, a jump of nearly 215% from the breakout level. Currently, the Fantom token price has achieved 107% of the projected price target.
Overbought RSI Clouds Over FTM Price Action
Meanwhile, FTM price dropped 7.7% to form a daily low near $0.455 on Jan 27. Sellers entering the market likely contributed to the drop in FTM price.
Additionally, the recent price rally forced the relative strength index of Fantom into the overbought region, with a value of 75.93 on the daily timeframe. Overbought RSI levels have traditionally preceded bearish trend reversals. As a result, traders consider the pattern a sell signal.

Should the selloff continue, the FTM/USD pair might drop to test support near $0.449. Additionally, breaching immediate support might force FTM price to fall 22.4% to reach $0.36 before recovering.
On the other hand, the 20-day EMA (red wave) needled above FTM’s 200-day EMA (green wave) on Jan 27, forming a bullish pattern called the Golden Cross. Market participants consider the pattern an indicator of positive investor sentiment and a buy signal.
Once buyers enter the market, the Fantom token price might rise to challenge resistance near $0.523. Breaking and consolidating above immediate resistance might push FTM price to resistance near $0.62 before downside corrections pare gains.

… [Trackback]
[…] Here you will find 1713 more Information on that Topic: coinchapter.com/fantom-ftm-price-spikes-151-in-2023-confirms-bullish-pattern/ […]
… [Trackback]
[…] Info on that Topic: coinchapter.com/fantom-ftm-price-spikes-151-in-2023-confirms-bullish-pattern/ […]
… [Trackback]
[…] Find More to that Topic: coinchapter.com/fantom-ftm-price-spikes-151-in-2023-confirms-bullish-pattern/ […]