
Key Bitcoin Price Takeaways:
- The Double Top setup on Bitcoin weekly chart could plunge it below $30,000.
- Several bullish factors claim that BTC could bottom out soon.
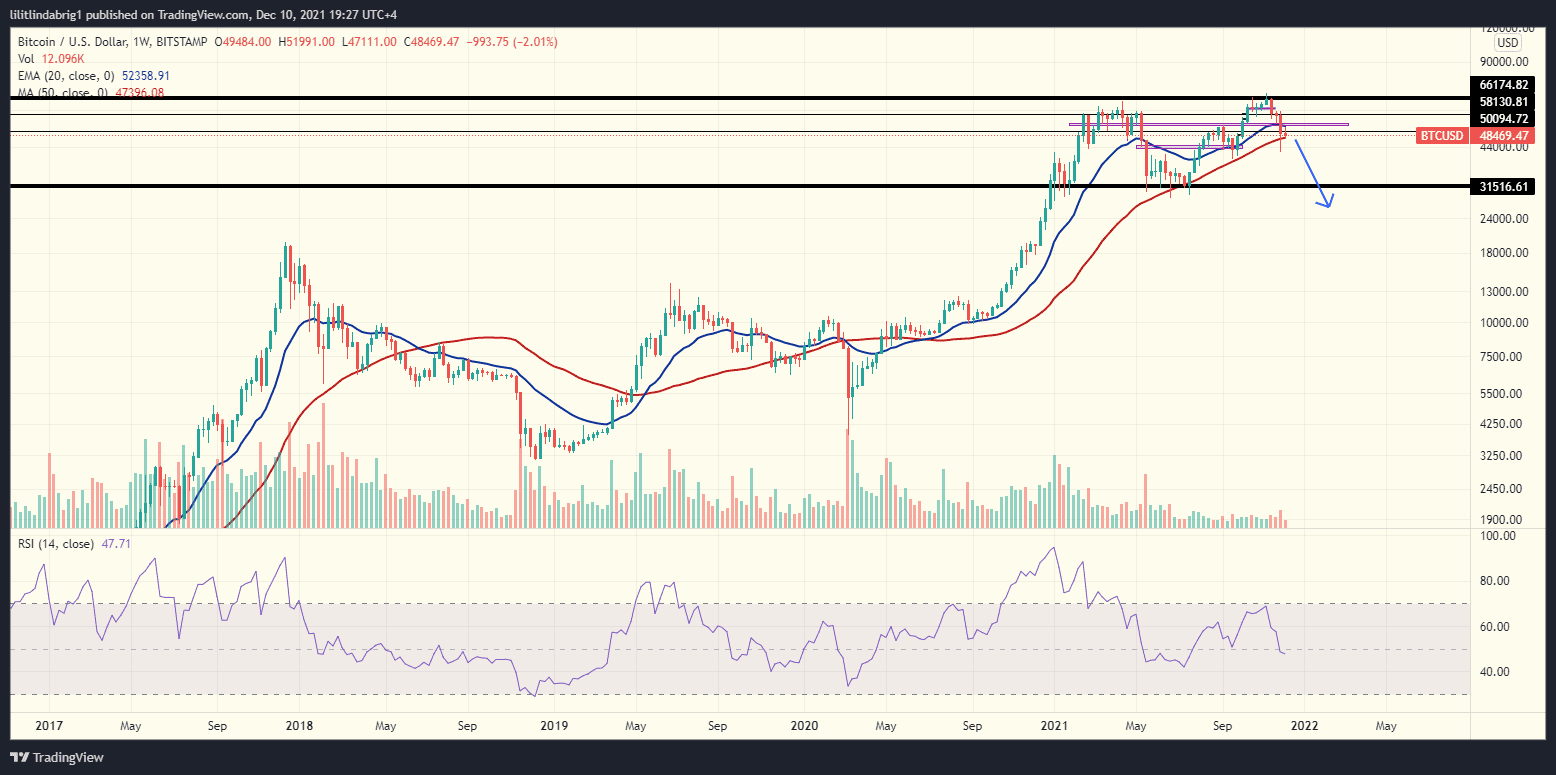
YEREVAN (CoinChapter.com) – Peter Brandt, the chief executive of the global trading firm Factor LLC, spotted a bearish ‘Double Top’ setup on the Bitcoin price weekly chart. The veteran investor pointed out that he’s “not a hater” and was surprised that the Twitterverse hasn’t been buzzing with the pattern already.
In detail, the Double Top is a bearish reversal pattern. It occurs when an asset’s price reaches roughly the same high level two consecutive times, with a moderate decline between the two tops. Moreover, Mr. Brandt added that a pattern is “NOT NOT NOT a pattern, until it is completed and confirmed.”
Also read: US SEC shows complications with Bitcoin ETF kindsThe Double Top setup suggests that an asset would confirm the pattern when the Bitcoin price falls below the support. In this case, the support is roughly on the $30,000 level. Thus, following Mr. Brandt’s assumption, the BTC price has not yet confirmed the setup, as it traded at $48,405 in the Friday session.
Also read: Bitcoin mining hashrate hits new yearly high seven months after China’s dreaded crypto crackdownDespite the bearish outlook on the charts, there are several bullish factors on the Bitcoin price side that could suggest an uptrend underway.
Whales at work?
Analytical platform Glassnode reported heightened activity among Bitcoin whales. The number of addresses holding over ten thousand BTC (almost half a billion dollars at the current price) has gone up to 90. The whales ‘buying the dip’ typically indicate approaching gains, so Bitcoin bulls could have something to celebrate soon.
Moreover, Glassnode also detected BTC outflow from exchanges. As of Dec 10, the outflow was over twice higher than the inflow, which points to a holding incentive among traders. The same pattern repeated itself for Ethereum and Tether Stablecoin, confirming the outlook. The accumulation trend also typically boosts the price of an asset.
In addition, another analytical platform, Ecoinometrics, detected similar patterns of whale and little fish behavior. However, the platform indicated, that both large and small addresses started pulling in the same direction again, which would typically be a bullish sign, but the “underlying data doesn’t look great.”
Ecoinometrics also added, that most buckets of Bitcoin addresses have started to “show some sideways action in their accumulation trend.” If the accumulation cool-off continues, Bitcoin could face more losses.
Also read: Stay calm and HODL? Bitcoin whale moves near $694M worth of BTC to a cold walletWhile the bulls and the bears struggle, the Bitcoin price stood below the $50,000 psychological resistance level, at $48,405. The upcoming sessions will show if the whales bought enough of the dip to cause an uptrend, or Mr. Brandt’s Double Top prediction will pan out.

… [Trackback]
[…] Read More on that Topic: coinchapter.com/veteran-investor-spots-bearish-setup-on-bitcoin-btc-price-chart-amid-whale-accumulation/ […]
… [Trackback]
[…] Find More Information here on that Topic: coinchapter.com/veteran-investor-spots-bearish-setup-on-bitcoin-btc-price-chart-amid-whale-accumulation/ […]