NEW DELHI (CoinChapter.com) — Aave’s namesake token moves inside a bearish pattern called the ‘rising wedge.’
Two upwards sloping and converging trendlines, joining higher highs and higher lows, form the said structure. Declining trading volumes often accompany a breakdown below the pattern.
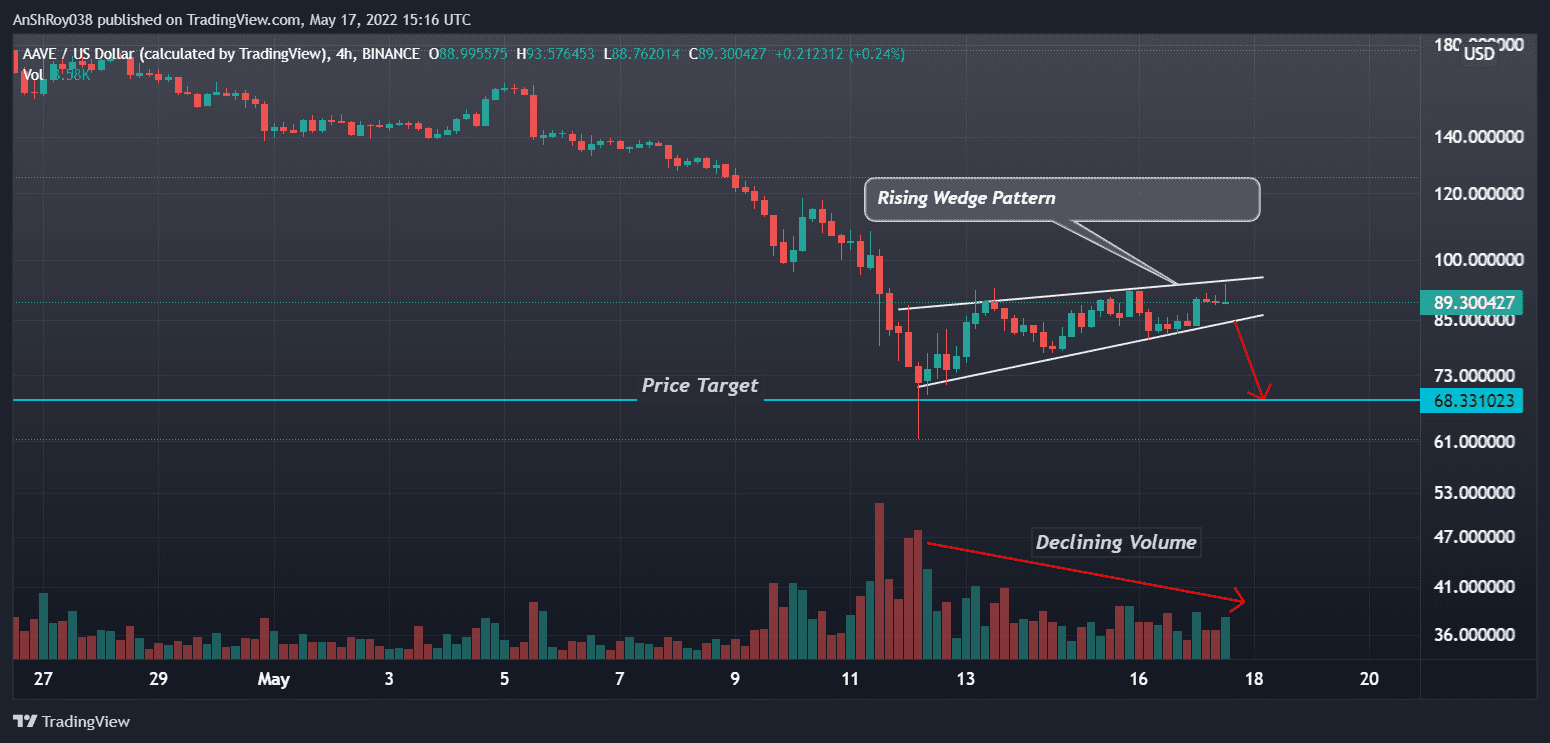
The price target of the pattern is equal to the height of the back of the wedge. If the token breaks below the bearish pattern, AAVE prices might fall to $68.3. Hence, the drop would mean a nearly 25% fall from current price levels.
Last week, the token fell alongside the wider crypto market as cryptocurrency prices crashed due to Terra’s UST and LUNA wipeout. However, the DeFi platform has been moving laterally since May 14, between $80 and $94.
It jumped more than 12% on May 17 between intraday low ($83.7) to high ($93.6), after starting the week down by nearly 9% on Monday.
Also Read: MakerDAO prices defy crypto market downtrend as MKR jumps 81% in six days.AAVE’s relative strength index stays near the oversold threshold of 30, currently neutral at 34.64. A move below 30 would make it oversold, indicating a trend reversal.

If AAVE fails to start an uptrend, the borrowing/lending platform might see its token fall to support near $82. Moreover, if Aave breaks below immediate support, the altcoin might fall to support near $74, which supported Aave’s price action between Dec 2, 2020, and Jan 3, 2021.
Finally, a marketwide sell-off could pull down Aave prices to support nearly $64, a price level the Aave token last saw in late November 2020.
Aave MACD Giving Bullish Cues
Meanwhile, MACD, a trend-based momentum oscillator, is forecasting a strengthening upward momentum for the Aave token.
Negative bars on the MACD histogram have been contracting, indicating that the MACD line (difference between 12-day and 26-day EMA) is moving towards the MACD signal line (9-day EMA of MACD) and may soon chart a bullish crossover.
Also read: AAVE price doubles in two weeks riding on bullish cues from V3 launch.Traders usually consider the technical pattern a buy signal.

If AAVE prices start an uptrend, the token would first need to move above immediate resistance near $99. Moreover, a move above immediate resistance might see Aave prices target resistance from their 20-day exponential moving average (20-day EMA, red wave) near $116.
$116 supported Aave prices between Feb 24 and Mar 16 earlier this year. Finally, a sustained uptrend might see Aave prices rise to $133, near its 50-day EMA (yellow wave), before corrections pull back prices.
At the time of writing, Aave was trading at $88.3, up 5.36% on the day.

… [Trackback]
[…] Read More here to that Topic: coinchapter.com/aave-risks-falling-by-25-on-rising-wedge-breakdown-fears/ […]
… [Trackback]
[…] Find More Information here to that Topic: coinchapter.com/aave-risks-falling-by-25-on-rising-wedge-breakdown-fears/ […]
… [Trackback]
[…] Info to that Topic: coinchapter.com/aave-risks-falling-by-25-on-rising-wedge-breakdown-fears/ […]
… [Trackback]
[…] Find More Information here to that Topic: coinchapter.com/aave-risks-falling-by-25-on-rising-wedge-breakdown-fears/ […]
… [Trackback]
[…] Read More Info here to that Topic: coinchapter.com/aave-risks-falling-by-25-on-rising-wedge-breakdown-fears/ […]
… [Trackback]
[…] Read More on on that Topic: coinchapter.com/aave-risks-falling-by-25-on-rising-wedge-breakdown-fears/ […]
… [Trackback]
[…] Information on that Topic: coinchapter.com/aave-risks-falling-by-25-on-rising-wedge-breakdown-fears/ […]