

NEW DELHI (CoinChapter.com) — The cryptocurrency market started 2022’s last week in the red, with several crypto tokens failing to start a rally. However, AI crypto tokens like Fetch (FET), Cortex (CTXC), Numeraire (NMR), and Ocean Protocol (OCEAN) are forming bullish technical patterns.
The lack of volatility in the crypto markets suggests that bulls and bears are playing it safe due to the uncertainty with the market’s next directional move. According to a Forbes report, the ongoing bear market has wiped $116 billion from the pockets of crypto founders and investors.
1. Fetch Network’s FET Forms Bull Flag Pattern
Fetch Network’s native token, FET, has formed a continuation pattern called the bull flag. Assets with strong uptrends usually form the pattern. Bull flags consist of a flag pole, resulting from a near-vertical rise in the crypto token’s prices.
A period of consolidation succeeding the vertical uptrend forms the flag of the pattern. Despite the strong vertical rally, the asset price does not drop as bulls maintain the buying pressure. As a result, the breakout from the flag pattern often results in a powerful uptrend.
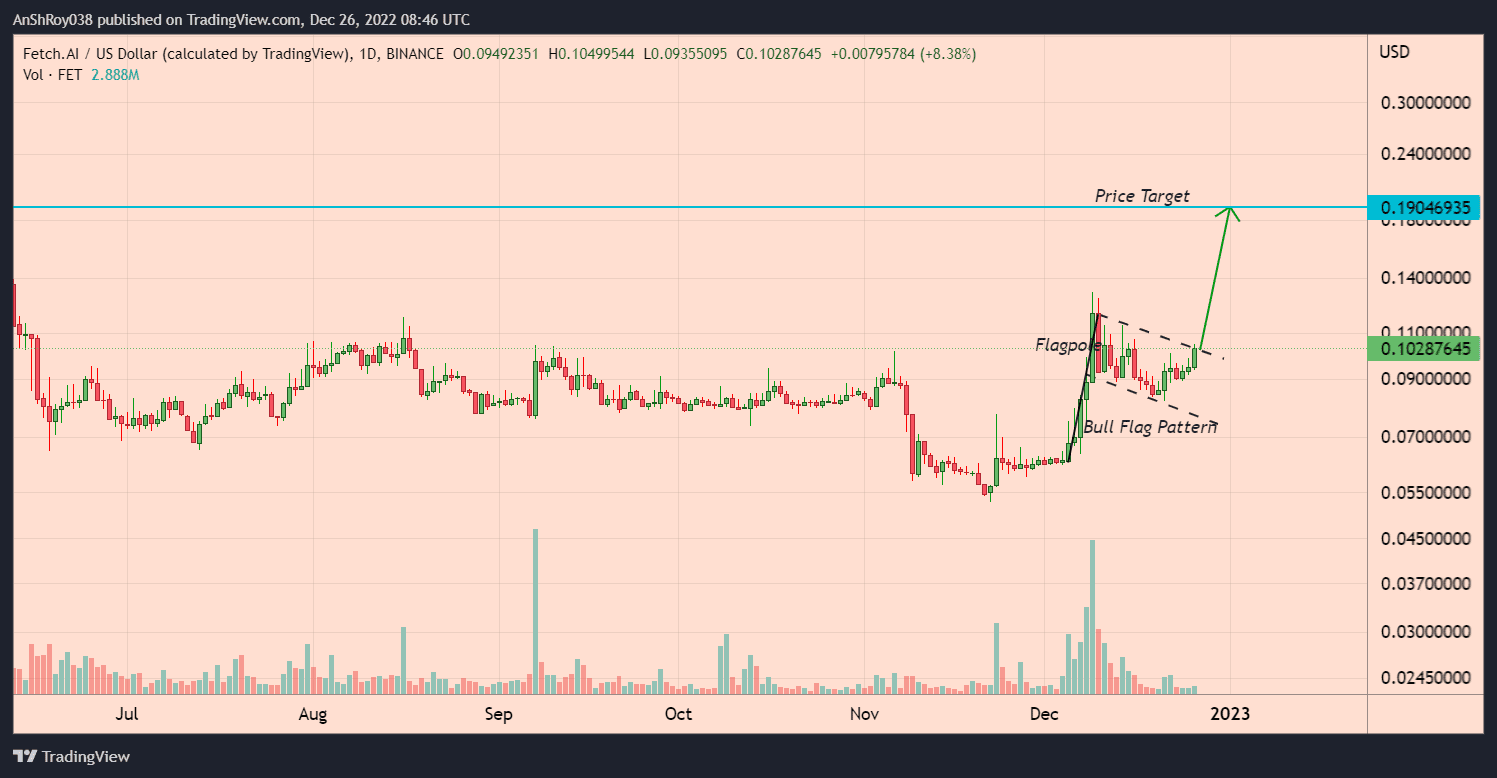
Traders calculate the price target of the breakout by adding the length of the flag pole to the breakout price level. Per the rules of technical analysis, FET price might reach $0.1905, a jump of more than 85% from its current levels.
More Bullish Signals For FET Coming Its Momentum Oscillator
FET prices jumped 29% since Dec 21’s low of $0.082 to form a daily high of $0.106 on Dec 26. Furthermore, the upward slope of the AI crypto token’s 20-day EMA (red wave) and 50-day EMA (purple wave) underscores the short-term bullish pressure for the Fetch.AI token.
The FET crypto token price jumped over 13% on Dec 26, starting the last week of the year at a high. In addition, the momentum oscillator MACD is forecasting bullish signals for the Fetch.AI crypto token.
Negative bars on the indicator’s histogram are contracting, indicating that the MACD line (difference between 12-day and 26-day EMA) is moving towards the MACD signal line (9-day EMA of MACD). When the MACD line moves above its signal line, it will form a bullish crossover.

The buy signal might attract traders to the market, helping propel FET price to target resistance near $0.107. A break and hold above immediate resistance could help the AI crypto token reach resistance from its 200-day EMA (green wave) near $0.12 before downside corrections pare gains.
On the other hand, if the uptrend fails, FET price might drop to support from its 20-day EMA (red wave) near $0.091. Breaching below immediate support might push the Fetch.AI crypto token price to test the support confluence of 50-day EMA (purple wave) and 100-day EMA (blue wave) near $0.083.
2. Cortex Native Token CTXC Attempting Breakout From Bull Pennant
CTXC, the in-house token of Cortex Labs, has formed a bullish continuation pattern called the Bull Pennant.
The pattern emerges when a crypto asset consolidates between two converging trendlines after undergoing a price rally. Ultimately, a breakout in the direction of the large initial movement follows the period of consolidation.
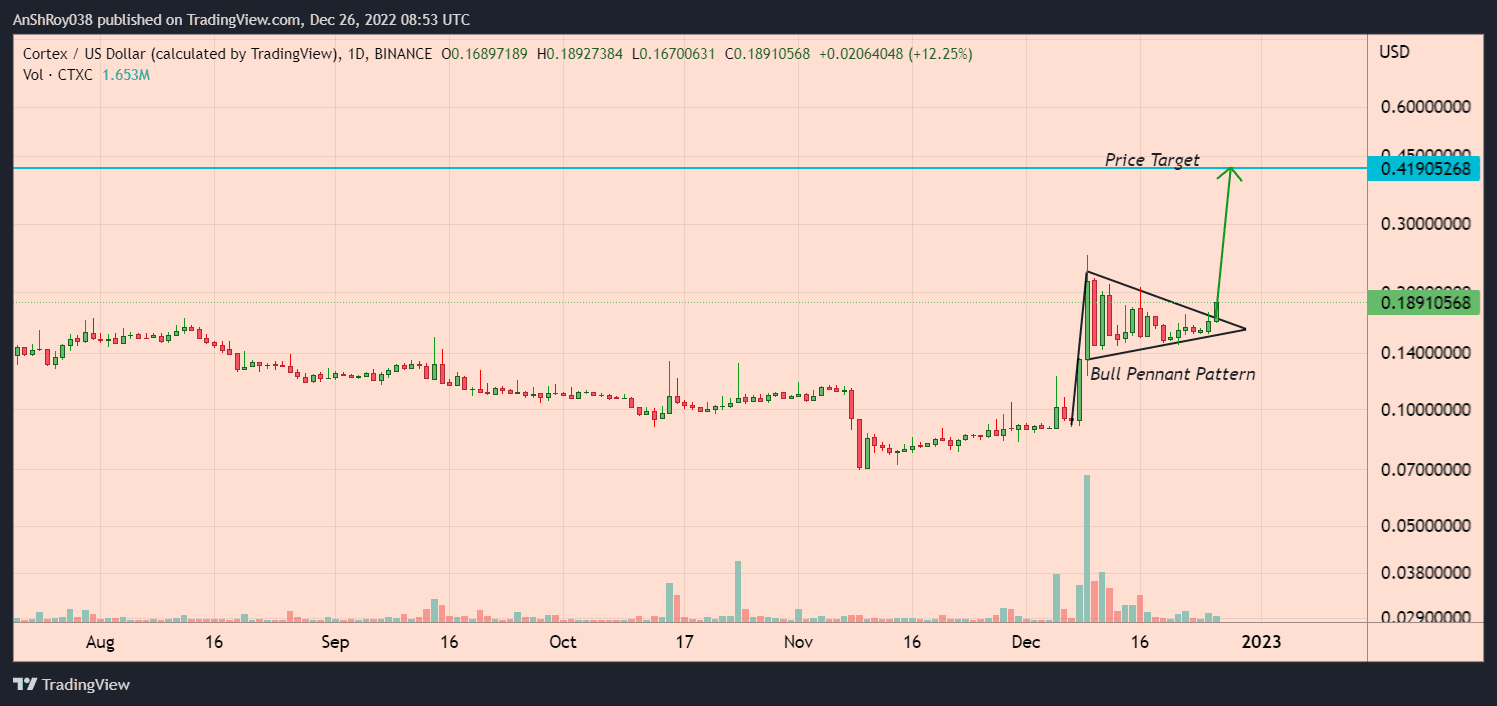
However, it is important to note the volume. As in, volume during consolidation should be low while it must increase during the breakout move. Otherwise, prices are more likely to pull back into the consolidation pattern.
Also Read: Bitcoin Price Shows Signs of Reversal But This Resistance Is The KeyCortex’s recent price rally has had CTXC break above its Bull Pennant. It now tests the structure’s upper trendline as support, hoping that a decisive continuation move upward would have it reach a target price of $0.419, jumping 121% from current levels in the process.
MACD For CTXC Close To Forming A Bullish Crossover
The upward-sloping 20-day EMA (red wave), 50-day EMA (purple wave), and 100-day EMA (blue wave) indicate the increasing bullish pressure for the Cortex AI crypto token. Furthermore, CTXC price jumped more than 13% on Dec 26 to form a high near $0.189 before bears started selling.
Meanwhile, the momentum oscillator MACD might form a bullish crossover.
Negative bars on the indicator’s histogram are contracting, indicating that the MACD line (difference between 12-day and 26-day EMA) is moving towards the MACD signal line (9-day EMA of MACD). When the MACD line moves above its signal line, it will form a bullish crossover.

The buy signal might attract traders to the market, helping CTXC price reach resistance near $0.194. Breaking and holding above immediate resistance might help the Cortex crypto price jump 30% to $0.234 before downside corrections pare gains.
On the other hand, if bears gain control of Cortex prices, the AI crypto token might drop to $0.165. Moreover, a breach below immediate support could see CTXC price test support from its 200-day EMA (green wave) near $0.138 before recovering.
3. Ocean Protocol’s OCEAN Price Form Falling Wedge Pattern
OCEAN, the in-house token of Ocean Protocol, has formed a bullish reversal pattern called the falling wedge.
In detail, the technical pattern forms when the price fluctuates inside a pair of falling trendlines that would converge down the slope. The outcome of such downside patterns is typically a price breakout to the upside.
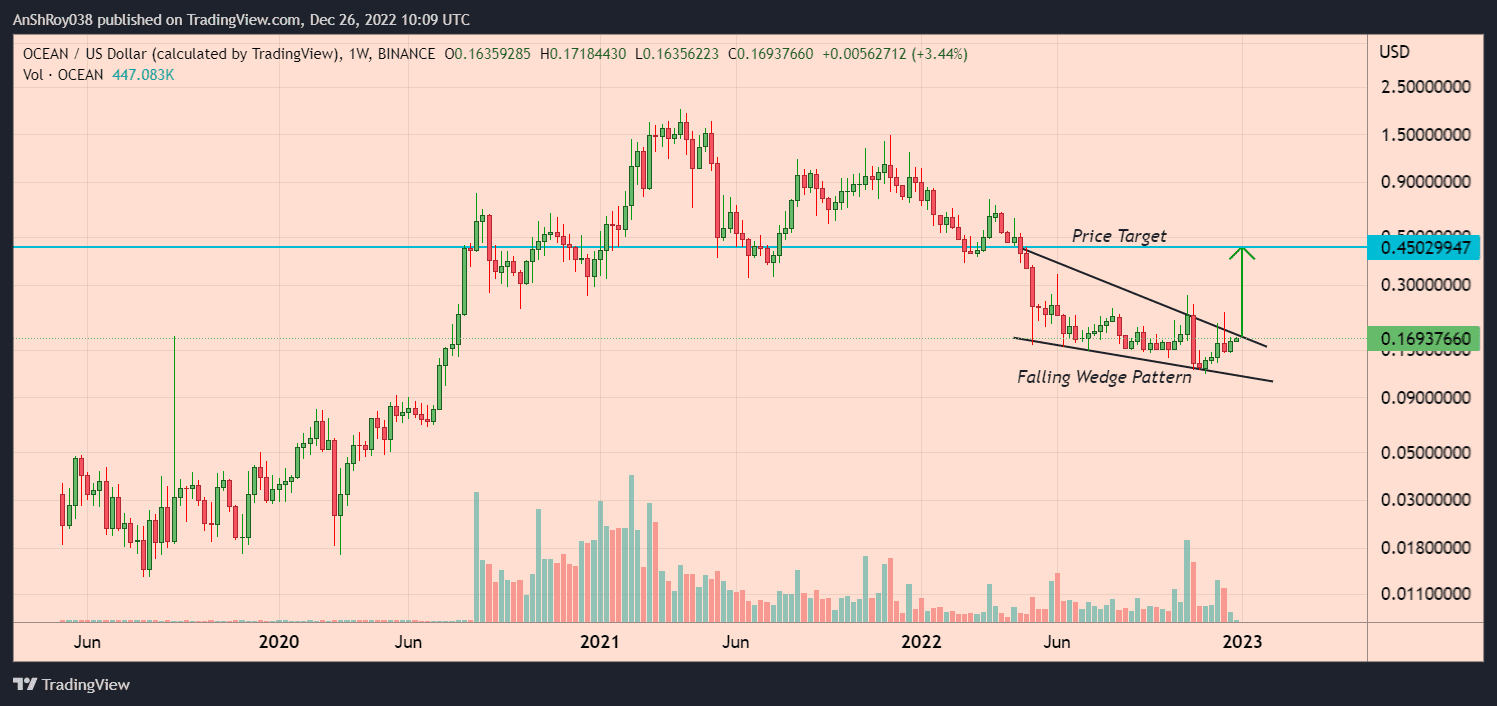
The upside target for the breakout is equal to the maximum distance between the falling wedge’s upper and lower trendlines.
As a result, OCEAN price might reach $0.45 after confirming the pattern, jumping nearly 166% in the process.
Continued Uptrend Might Help OCEAN Form A Golden Cross
OCEAN price jumped 6.73% on Dec 26 to form a daily high near $0.175 before bears pared some of the gains. The token’s upward-sloping 20-day EMA (red wave) highlights the short term bullishness of the AI crypto token’s price action.
Meanwhile, the recent price action has left the AI crypto token’s 20-day EMA (red wave) poised to needle above its 100-day EMA (blue wave) to form a bullish technical pattern called the golden cross. Traders consider the pattern an indicator of positive market sentiment and a buy signal.
Also Read: Bitcoin Price Signals Bearish Turn, Why Upsides Could be Attractive to SellersIf the uptrend continues, OCEAN price might rise to resistance near $0.18. Moving and consolidating above immediate resistance could help OCEAN crypto challenge resistance near $0.2 before downside corrections pare gains.

On the other hand, if bears manage to stop the uptrend, the OCEAN crypto token might needle below its 100-day EMA (blue wave) to test support from the 20-day EMA near $0.159. If the immediate support fails, OCEAN price might drop to $0.143 before recovering.
Relative strength index for the Ocean Protocol token is neutral, with a value of 60.39 on the daily charts.
4. Numeraire (NMR) Price Momentum Likely To Turn Bullish Despite Bearish Pressure
Numeraire price rose nearly 22% over the past seven days to reach a daily high of $14.2 on Dec 26 before bears pared gains. Long upper wicks on NMR price’s daily candles indicates that bears are selling on relief rallies.
If the bears continue to sell, NMR price might fall below its 20-day EMA (red wave) to test support near $12.6. Moreover, breaching below immediate support could result in the AI crypto token dropping to $11.4 before recovering.

Meanwhile, the momentum oscillator MACD seems ready to form a bullish crossover.
Negative bars on the indicator’s histogram are contracting, indicating that the MACD line (difference between 12-day and 26-day EMA) is moving towards the MACD signal line (9-day EMA of MACD). When the MACD line moves above its signal line, it will form a bullish crossover.
Buyers might enter the market once the pattern forms, helping push NMR price to reach resistance from its 100-day EMA (blue wave) near $13.8. A break and hold above immediate resistance could help the NMR crypto challenge resistance near $15.5 before downside corrections pare gains.
Read here to know more about the latest updates in the Ripple-SEC lawsuit

… [Trackback]
[…] Here you will find 13734 additional Information to that Topic: coinchapter.com/ai-crypto-price-analysis-fet-ctxc-nmr-ocean/ […]
… [Trackback]
[…] Read More on on that Topic: coinchapter.com/ai-crypto-price-analysis-fet-ctxc-nmr-ocean/ […]