
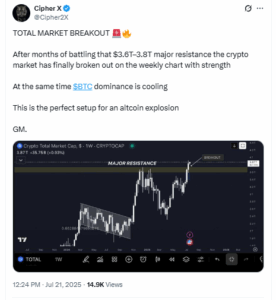
The crypto market has moved above $3.8 trillion for the first time in months. This move came after a long period of sideways trading. Trader Cipher X said the breakout could lead to a big rally in altcoins. He also noted that Bitcoin’s market dominance is starting to fall, which often leads to altcoin gains.
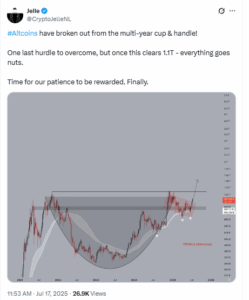
Analysts like Peter Brandt and CryptoJelle have also shared similar views. Brandt said the altcoin market has broken out of a pattern called a cup-and-handle. He said this pattern is visible on the TOTAL2 chart, which tracks the market cap of all cryptocurrencies except Bitcoin (BTC). Based on this breakout, Brandt expects the market cap to rise to $2.78 trillion. This would be a 97% increase from current levels.
CryptoJelle also spotted the same pattern on the TOTAL3 chart. This chart tracks altcoins excluding both Bitcoin and Ethereum. He believes TOTAL3 could rise to $2 trillion from its current level near $1.1 trillion. That would mean a gain of around 67%. Both analysts said the breakout is already happening, not just forming.
Ethereum Market Share Reaches Highest Level Since December
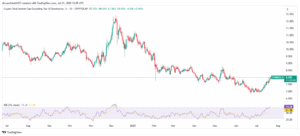
Ethereum (ETH) is leading the current rally among altcoins. Its share of the total crypto market cap, known as ETH dominance or ETH.D, has climbed to 11.88% as of July 21. This is the highest it has been since December last year. The Relative Strength Index (RSI) for ETH.D is now at 86.07, which shows strong buying activity.

This rise is supported by institutional demand. Ethereum-based exchange-traded funds (ETFs) saw consistent inflows during July. Between July 10 and July 17, products like ETHA and FETH posted daily net inflows ranging from 100 to over 500 units. On July 17 alone, ETHA recorded 546.7 units in inflow. In total, ETH ETFs brought in more than 7,500 units over the month.
At the same time, Ethereum open interest in futures markets has crossed $45 billion. These signs suggest that Ethereum is gaining strength both in price and investor confidence.
It’s not just Ethereum that is rising. Many smaller altcoins are also seeing more activity. The OTHERS.D chart, which tracks the market share of all coins outside the top 10, rose to 8.00% on July 21. Just a few weeks ago, it was around 6.6%. The RSI on this chart is now at 74.28, showing increased interest in mid- and small-cap altcoins.
This shift shows that traders are starting to invest beyond just the top few coins. In past market cycles, altcoin rallies often began with Ethereum and later spread to smaller assets. The rise in OTHERS.D suggests that the second phase of the rotation is beginning.
Altcoin Season Index Shows Progress, But No Confirmation Yet
The Altcoin Season Index tracks how many of the top 50 altcoins are performing better than Bitcoin over the past 90 days. When 75% or more are outperforming Bitcoin, the index marks the start of an altcoin season. Right now, the index is at 55. This means the market is not yet in a full altseason, but it is moving in that direction.
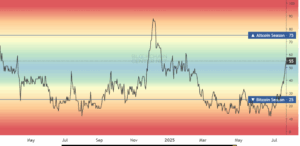
Last month, the index was under 20. This steady increase shows that more altcoins are starting to gain strength. Analysts say a confirmed altseason could happen if this trend continues and the index crosses 75.
