
MANALI (CoinChapter.com) — Blockchain ecosystem IOST announced the launch of Project Entroverse, which will introduce EVM compatibility and other features on the network. The launch would help IOST “inch closer” to its goal of becoming a powerful interoperable blockchain, the announcement said.
Project Entroverse would also introduce IOSTSWAP, an IOST-Ether (ETH) cross-chain bridge that would enable users to transfer tokens from the IOST blockchain to Ethereum and vice versa, boosting interoperability.
Phase 2 of the project would introduce EVM compatibility to IOST. The blockchain platform stated that integrating Ethereum protocols with IOST would save developers and users’ time and energy. In addition, users would have access to a broader DApp pool.
IOST said the platform would create a compatibility layer on its network to make developing across chains more streamlined.
In a cryptoverse where individual projects rely on ever-increasing levels of collaboration and interaction, it is not only desirable but also vital for IOST to kick off a cross-chain bridge, EVM compatibility function, and Project Entroverse.
IOST CEO, Jimmy Zhong, saidIOST Price Charts
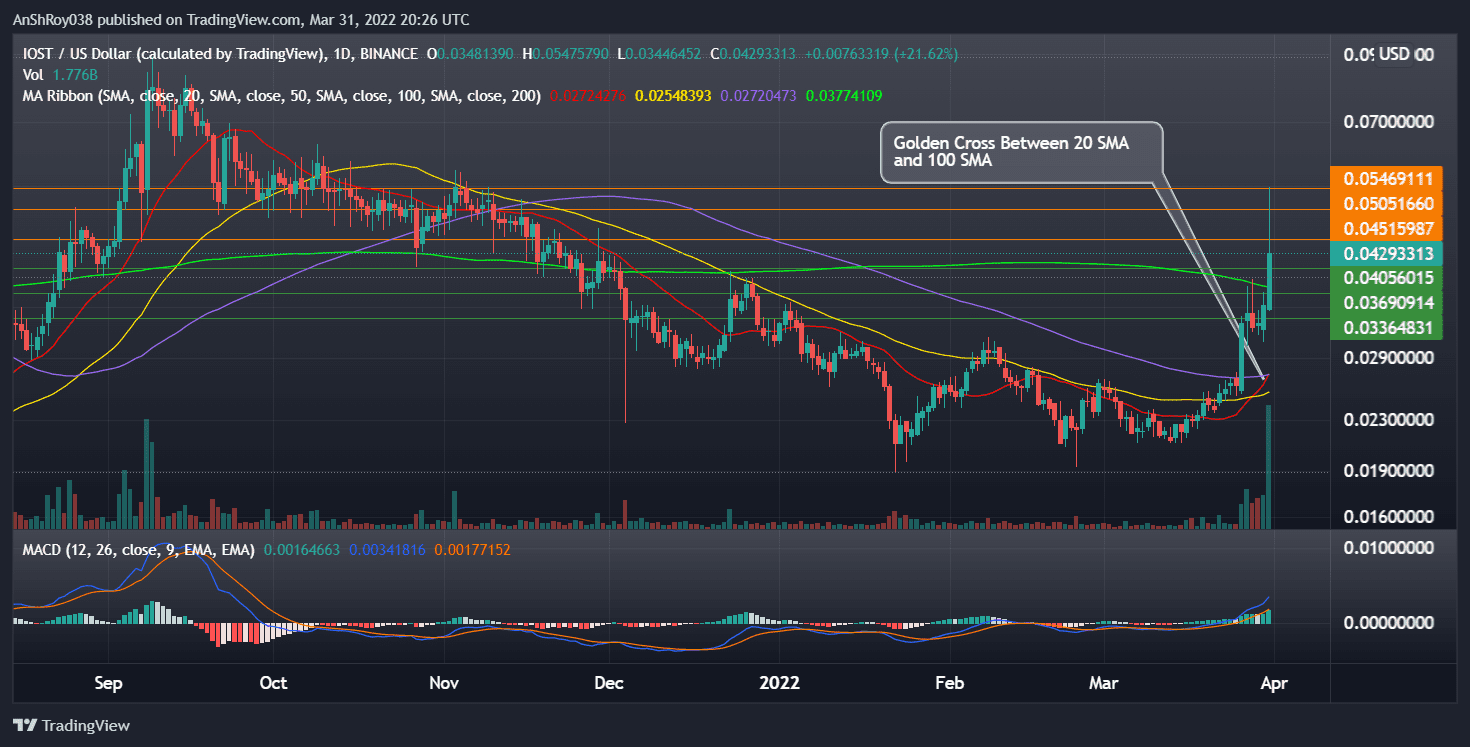
Meanwhile, the IOST token has more than doubled in price over the last six days. The digital asset gained 26% on Mar 26, after which it moved laterally for a few days. On Thursday, IOST rose from the day’s low of $0.0344 to jump nearly 59% and reach $0.055 before prices pared.
Also Read: Mina Protocol (MINA) pumps over 6% in anticipation of Coinbase trading to start.The long wick on Mar 31’s daily candle the aggressive selling pressure from bears. However, IOST’s 20-day Moving Average (red wave) moved above its 100-day MA (purple wave), forming a bullish technical pattern called the golden cross.
In detail, a golden cross forms when a short-term MA line moves above a relatively long-term one. Traders and analysts usually interpret the pattern as an indicator of a definitive uptrend in the market. Hence, it is likely bulls would try to continue the IOST token’s uptrend.
Furthermore, the momentum oscillator MACD continues to chart expanding bars on its histogram, indicating the MACD line (difference of 12-day and 26-day EMA) is moving away from the MACD signal line (9-day EMA of MACD). Expanding histogram bars indicate strengthening bullish momentum.
As a result, if IOST’s rally continues, the token would likely flip immediate resistance at $0.0452. The digital token would then consolidate before moving to target resistance near $0.051, a price level that previously supported IOST’s rally between Sept 3 to Oct 18.
Finally, IOST has resistance near $0.055.
Overbought Indicators Suggest Trend Reversal Likely84.5
The IOST token is currently overbought, with the relative strength index moving above the benchmark value of 70 since Mar 26. Currently, the token’s RSI is at 84.56 on the daily charts. Traders often consider an overbought RSI a prelude to an upcoming trend reversal in bears’ favor.
Also Read: Solana wipes all losses made since February as SOL paints a golden cross – what’s ahead?Moreover, the token also broke above the upper trendline of the Bollinger Bands indicator.
In detail, Bollinger bands consist of a simple moving average (middle band) and an upper and lower band. The two bands are usually two standard deviations from the middle band. Therefore, when an asset’s prices break above the upper bands, it denotes an overbought condition.

Traders relying on either of the two indicators would likely start a sell-off to profit from the IOST token’s recent uptrend. As a result, IOST could fall to immediate support near $0.0406, a price level that acted as support for the token between Oct 27, 2021, to Dec 3, 2021.
A marketwide sell-off could push the digital asset’s prices to support from its 200-day MA (green wave) at $0.037. If the 200-day MA support fails to arrest the token’s downfall, support near $0.034 would come into play.
At the time of writing, IOST was trading at $0.0426, up 20.66% on the day.

… [Trackback]
[…] Find More here on that Topic: coinchapter.com/iost-on-path-to-become-evm-compatible-as-its-token-jumps-116-in-six-days/ […]
… [Trackback]
[…] Info on that Topic: coinchapter.com/iost-on-path-to-become-evm-compatible-as-its-token-jumps-116-in-six-days/ […]