
 price is up 65% YTD, but on-chain metrics see a looming plunge")
YEREVAN (CoinChapter.com) – Apecoin (APE) started February at $5.8, experiencing a moderate setback after a nearly 80% rally year-to-date. The digital asset partially pared its gains, bringing the overall uptrend to 65%, but several metrics point to a drop ahead.
APE technicals ambiguous
In detail, the altcoin has been trading within a ‘rising channel’ formation YTD. The setup features two rising parallel trendlines with a significant mid-range. The channel prevented sharp moves through consecutive support and resistance retests and can still be instrumental for short-term predictions as long as it remains relevant.
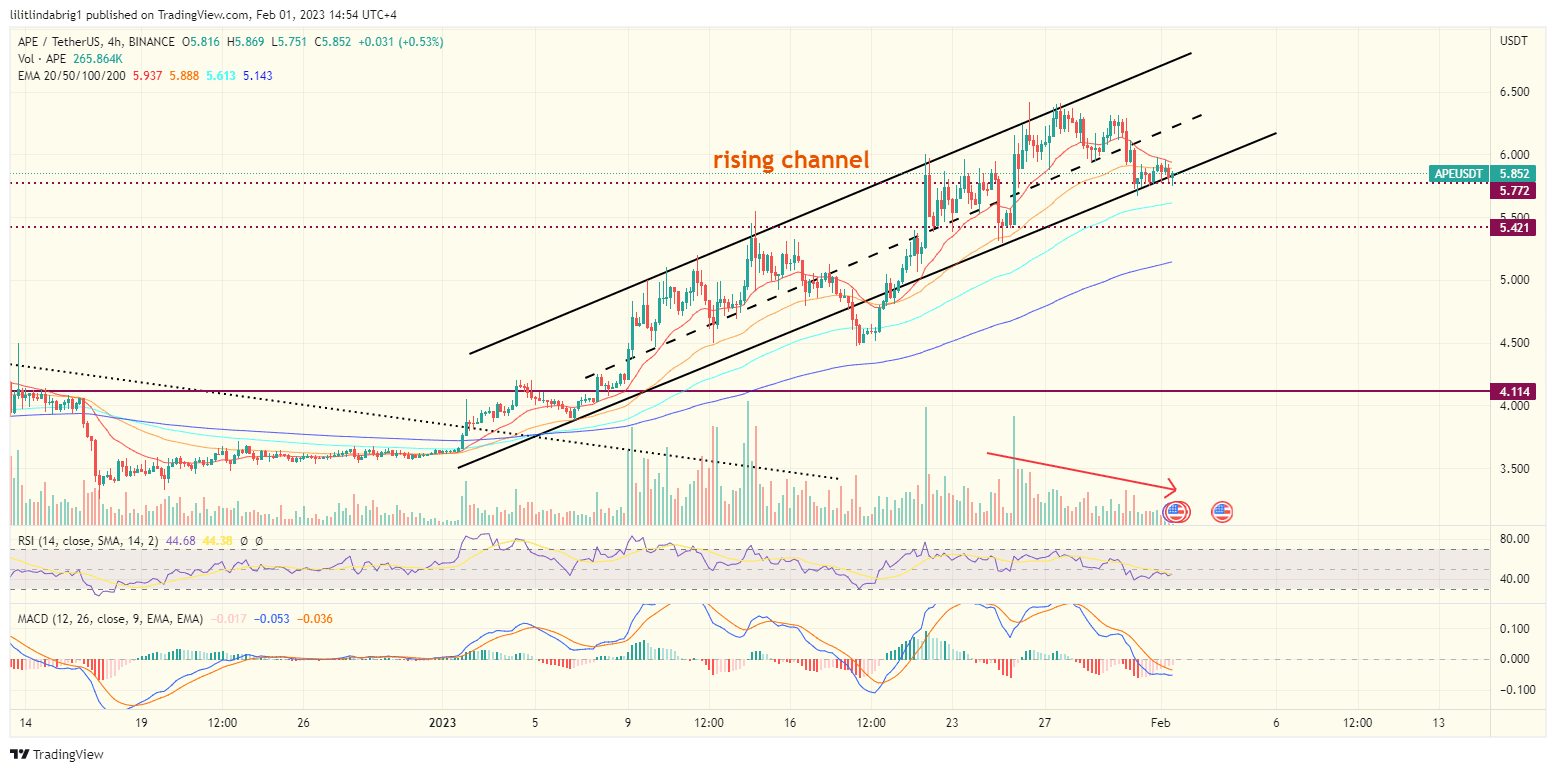
The APE/USD price action dropped to the channel’s support and retested the latter on multiple occasions throughout Jan 31 and Feb 1. The pattern does suggest a rise to the mid-range next. However, the dropping trading volumes testify to the contrary. Apaecoin price is likely to drop below the said support in the upcoming sessions, spurred by the overall cool-off on the Bitcoin charts as well.
Also read: CBDC projects pump in 2023 – crypto folks not thrilled.
Should APE correct further downward, the target price would stand at $5.42-5.60, the previous resistance/support zone. If the Apecoin bulls manage an uptrend after all, the APE price could climb to approximately $6.2, before it’s challenged by the mid-range.
Meanwhile, the on-chain metrics point in the bearish direction.
Apecoin on-chain metrics hint at a looming drop.
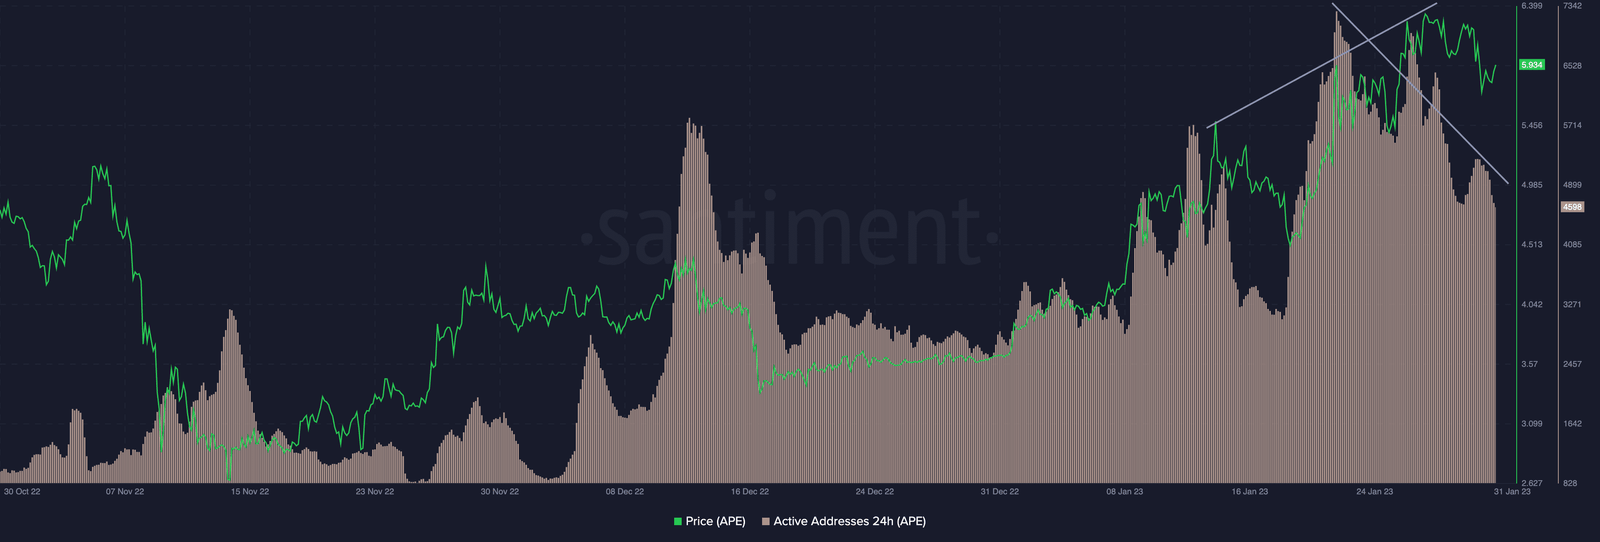
Crypto analytical platform Santiment noted several divergences between the APE price and several Apecoin metrics. For example, while the price action printed higher highs, the daily active addresses (DAA) declined, as shown in the diagram below.
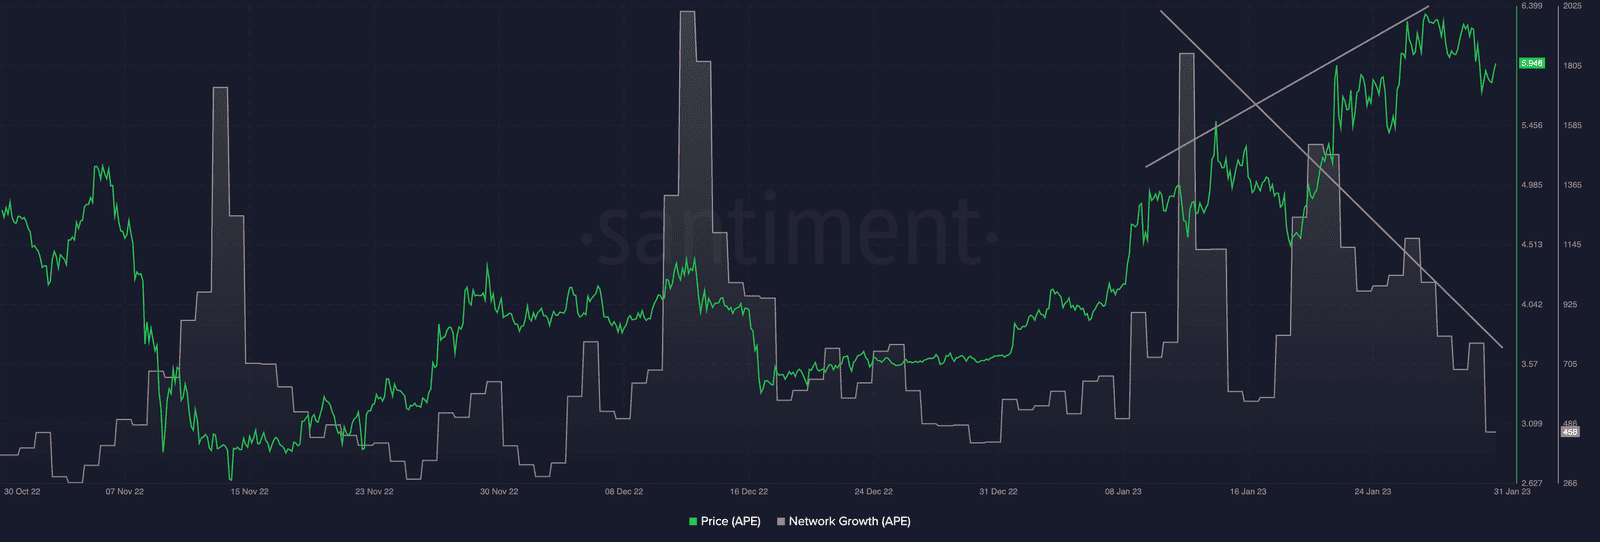
Apecoin exhibited a similar dissonance between the price and the Network growth, as well as whale activity. Santiment noted that a combination of the three bearish metrics suggests “the local top is probably done.”
Also read: FOMC Meeting: Fed likely to hike interest rates by 25 bps – but recession fears persist
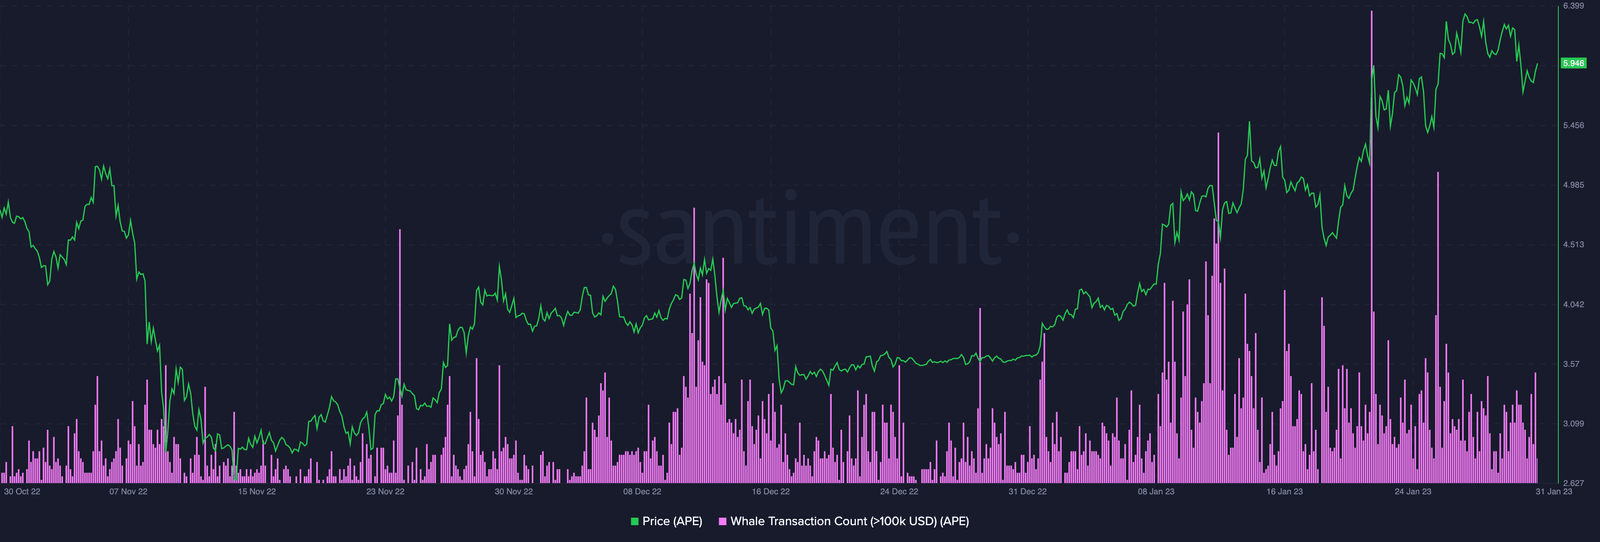
The chart above, i.e., the lowering whale transactions, could also be interpreted in a bullish way, claiming that the wallets prefer to hold for the long term. Only another metric, the overall APE whale number, is declining, which negates the bullish argument. Thus, the overall climate of the Apecoin market is not likely to remain bullish for long.
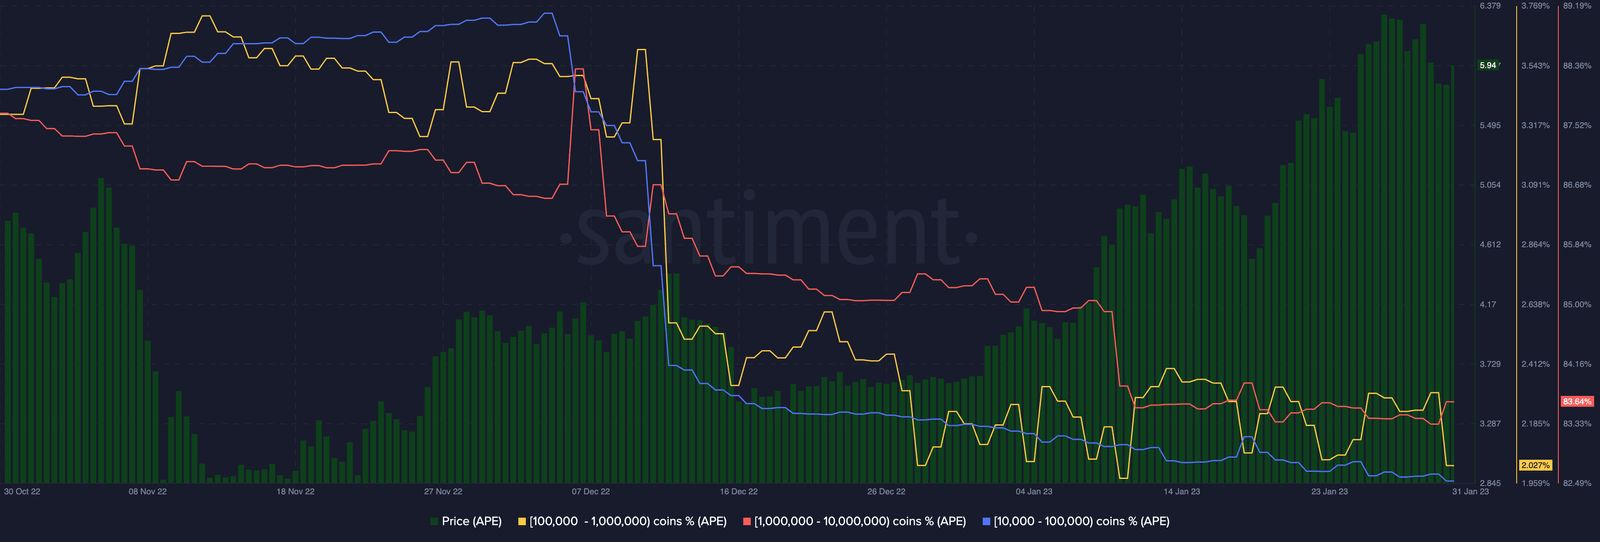
Why do we read it like this? It’s like the fuel for the rally is over. A healthy trend is built on higher highs both in price and on-chain activity. A case with whale transactions was backtested by Santiment earlier. Long story short: a spike in WTC often indicates a price top.
concluded the platform. Also read: Dogecoin Price Prediction: DOGE Loses 7% After Elon Shilling.

… [Trackback]
[…] Read More Info here to that Topic: coinchapter.com/apecoin-ape-up-65-ytd/ […]
… [Trackback]
[…] Find More on on that Topic: coinchapter.com/apecoin-ape-up-65-ytd/ […]
… [Trackback]
[…] Here you will find 1117 additional Info on that Topic: coinchapter.com/apecoin-ape-up-65-ytd/ […]
… [Trackback]
[…] Info on that Topic: coinchapter.com/apecoin-ape-up-65-ytd/ […]
… [Trackback]
[…] Info on that Topic: coinchapter.com/apecoin-ape-up-65-ytd/ […]
… [Trackback]
[…] Read More here to that Topic: coinchapter.com/apecoin-ape-up-65-ytd/ […]
… [Trackback]
[…] Info on that Topic: coinchapter.com/apecoin-ape-up-65-ytd/ […]