

NEW DELHI (CoinChapter.com) — Meme token Baby Doge Coin (BABYDOGE) price spiked 82.5% since Jan 1 to form a daily high of $0.00000000161 on Jan 30. The rally helped the Dogecoin-inspired token confirm a bullish technical pattern called the falling wedge.
In detail, the technical pattern forms when the price fluctuates inside a pair of falling trendlines that would converge down the slope. The outcome of such downside patterns is typically a price breakout to the upside.
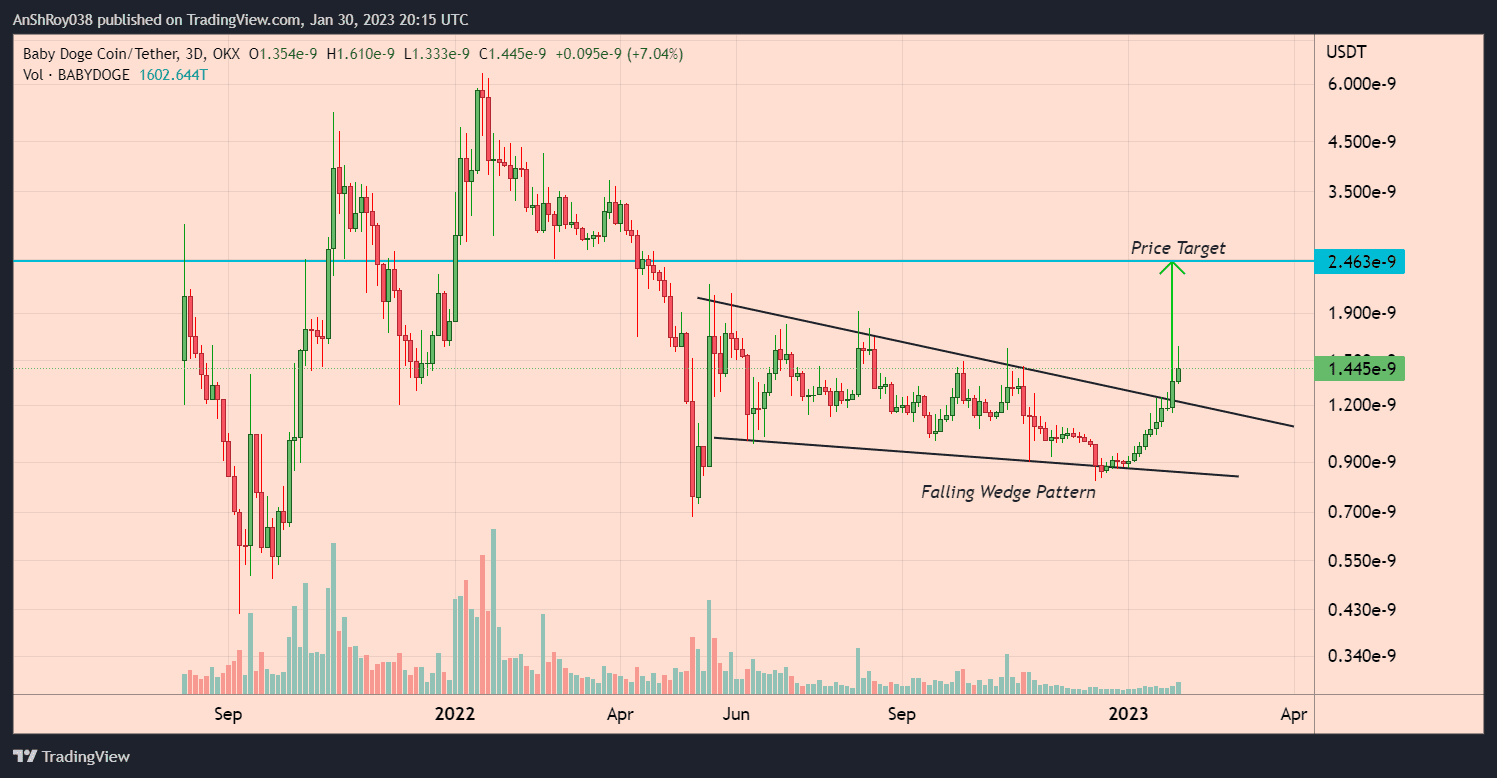
The upside target for the breakout is equal to the maximum distance between the falling wedge’s upper and lower trendlines. As such, BABYDOGE price might rise to $0.000000002463, a jump of 70.4% from current levels.
Also Read: China says Biden Administration started the Ukraine war to profit from itMeanwhile, Baby Doge Coin developer team announced burning 33.67 trillion BABYDOGE tokens in 24 hours. Including the recent burn event, a total of 201.3 quadrillion Baby Doge tokens have been burnt by the team, nearly 48% of the meme token’s total supply of 420 quadrillion tokens.
BABY DOGE Price Action Likely To Form Consecutive Golden Cross
Meanwhile, the upward rally helped Baby Doge Coin form a golden cross between the token’s 50-day EMA (purple wave) and 100-day EMA (blue wave). Traders often consider the pattern an indicator of positive market sentiment and a buy signal.
Furthermore, if the BABY DOGE price rally continues, the meme crypto might form another golden cross between its 200-day EMA (green wave) and 20-day EMA (red wave). The consecutive bullish patterns suggest investors remain bullish about BABYDOGE price action.

However, despite the bullish cues, Baby Doge Coin price dropped over 11% on Jan 30 to form a daily low near $0.00000000143.
Long upper wicks on the daily candles underscore the bearish pressure against BABYDOGE price. Should the selloff continue, the Baby Doge Coin price might drop to $0.00000000135. Breaching below immediate support might force BABYDOGE price to test support near $0.00000000126 before recovering.
On the other hand, an upward trend would see the Baby Doge Coin price face resistance near $0.00000000155. A break and hold above immediate resistance might help BABYDOGE price target resistance near $0.00000000174 before downside corrections pare gains.

… [Trackback]
[…] Info on that Topic: coinchapter.com/baby-doge-coin-price-breaks-out-of-bullish-pattern/ […]