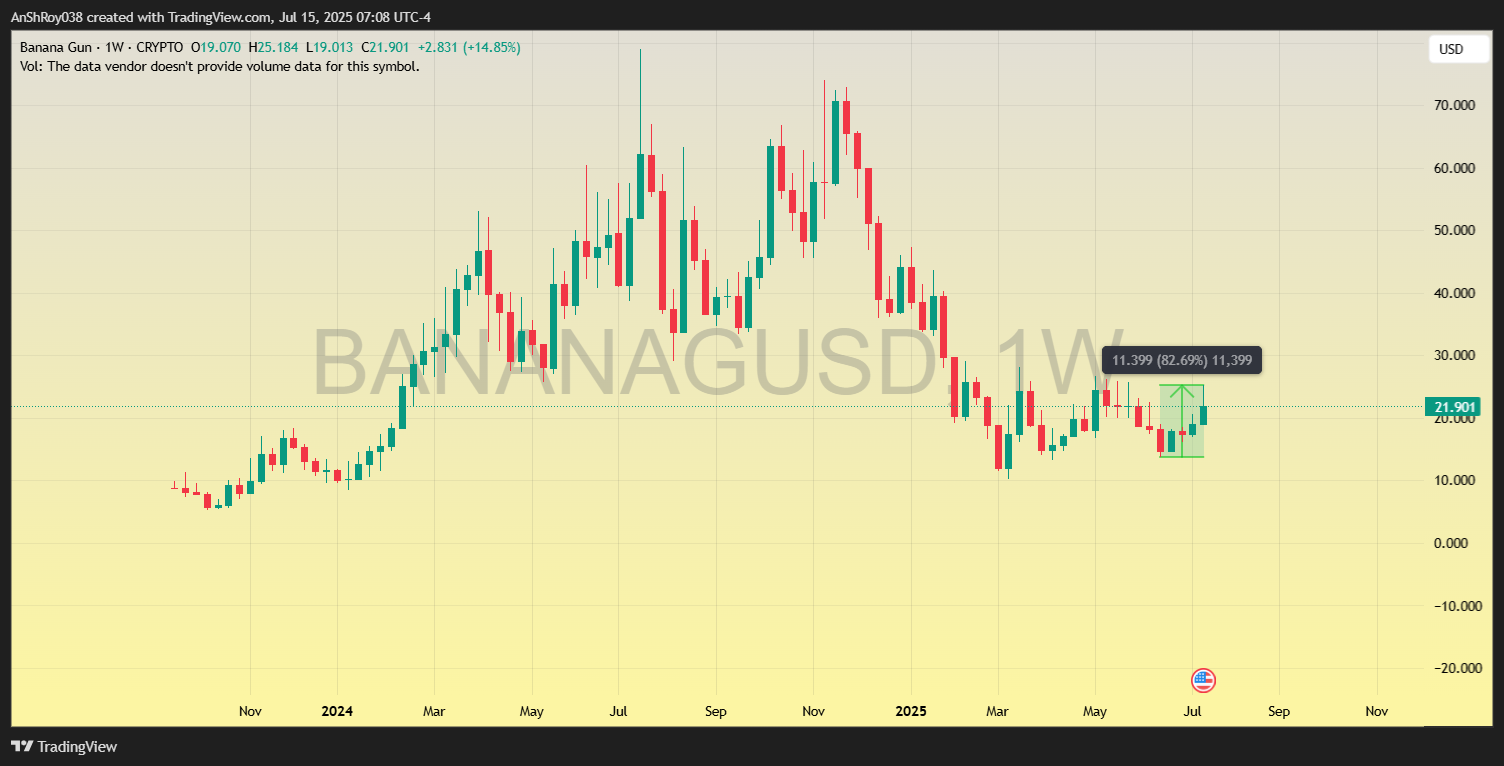
Banana Gun (BANANA) surged to roughly $22.00 after dipping to $13 in June earlier this year. Since June 16, the BANANA coin price has spiked by more than 82%, reaching a multi-week high near $25 on July 15. The spike came as the crypto market woke from its spring slump.
Bitcoin and Ethereum both pushed higher across July, loosening liquidity and reviving risk appetite in altcoins. That shift has buoyed protocols like Banana Gun—which combines Telegram-based sniping tools with token-based incentives—as investors hunt for niche utility plays.
Traders Go BANANAs, Target $33 to $189
Banana Gun’s recent price jump has caught the attention of technical analysts who now see it as one of the sharper breakout candidates in the altcoin space. The token broke out of a multi-month falling wedge pattern last week and has since reclaimed the $22 zone—flipping a previous resistance band into short-term support.
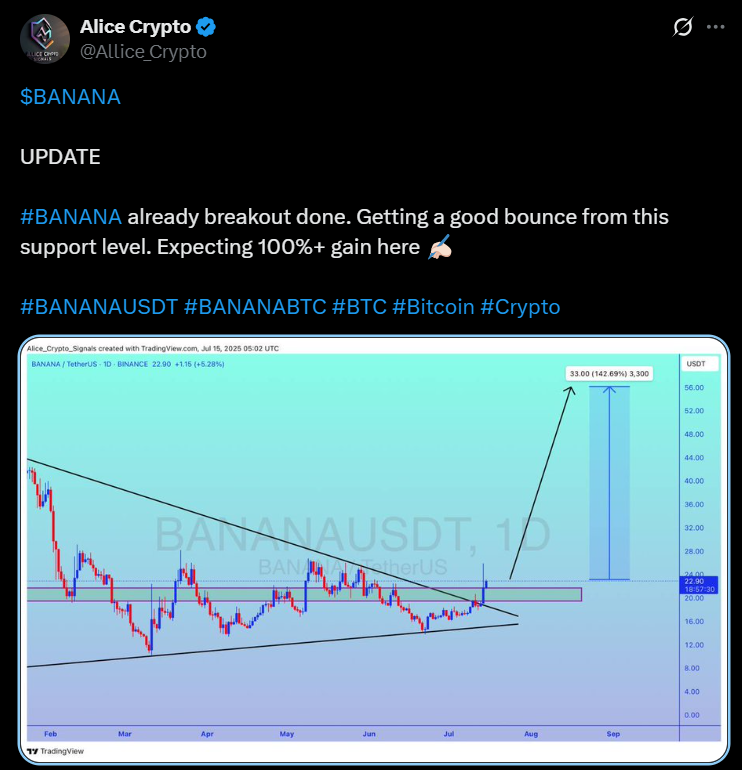
Analyst Alice Crypto expects this move to extend toward $56, marking a 142% upside from the breakout level. The setup leans on a clean breakout from a descending trendline combined with a retest of prior support between $19 and $20. Volume has also expanded on the daily timeframe, suggesting the breakout has legs.
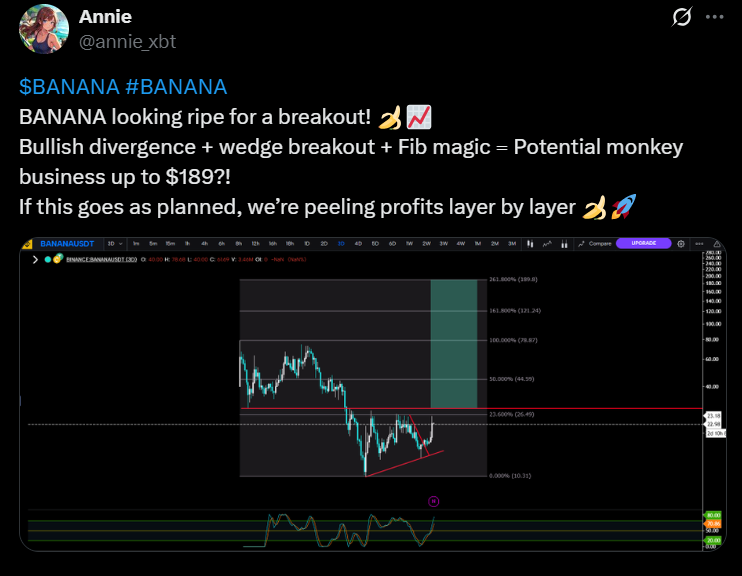
Annie_XBT highlighted a similar wedge breakout, pointing to bullish divergence on the RSI and Fibonacci extensions as technical justification for a much larger move. She floated an aggressive upside target near $189, drawn from the 261.8% extension. While speculative, the setup reflects how traders are beginning to price in outsized returns amid revived market sentiment.
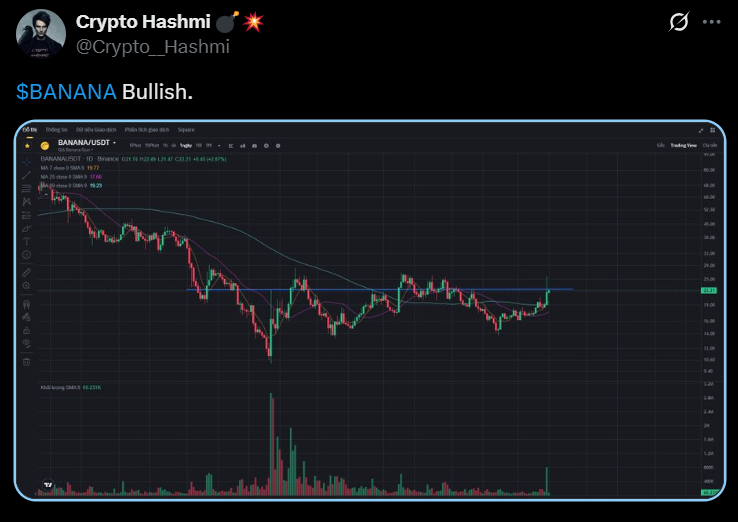
Adding to the momentum, another analyst, Crypto Hashmi, posted a clean reclaim of horizontal resistance, noting the bullish shift in structure as the price reclaimed the 50-day and 100-day moving averages.
Together, these signals reinforce the shift in trend. However, for BANANA to sustain its rally, the $21–$22 area needs to be held as a base. Any break below that zone could invalidate short-term bullish momentum and delay further upside.
What The Author Thinks
The following is the author’s views regarding BANANA coin’s price action. It is not financial advice in any way, and should not be interpreted as such. CoinChapter and the author will not be responsible for any untoward occurrence resulting from taking piece as financial advice. Readers are ADVISED to Do Their Own Research
Banana Gun’s weekly chart confirms a textbook ascending triangle. This is an accumulation pattern typically characterized by rising higher lows pressing into a flat overhead resistance. The structure reflects increasing buyer aggression and weakening seller dominance at a fixed ceiling. In this case, that ceiling lies near the 0.618 Fib level at $23.63, just below the immediate hurdle at $26.88.
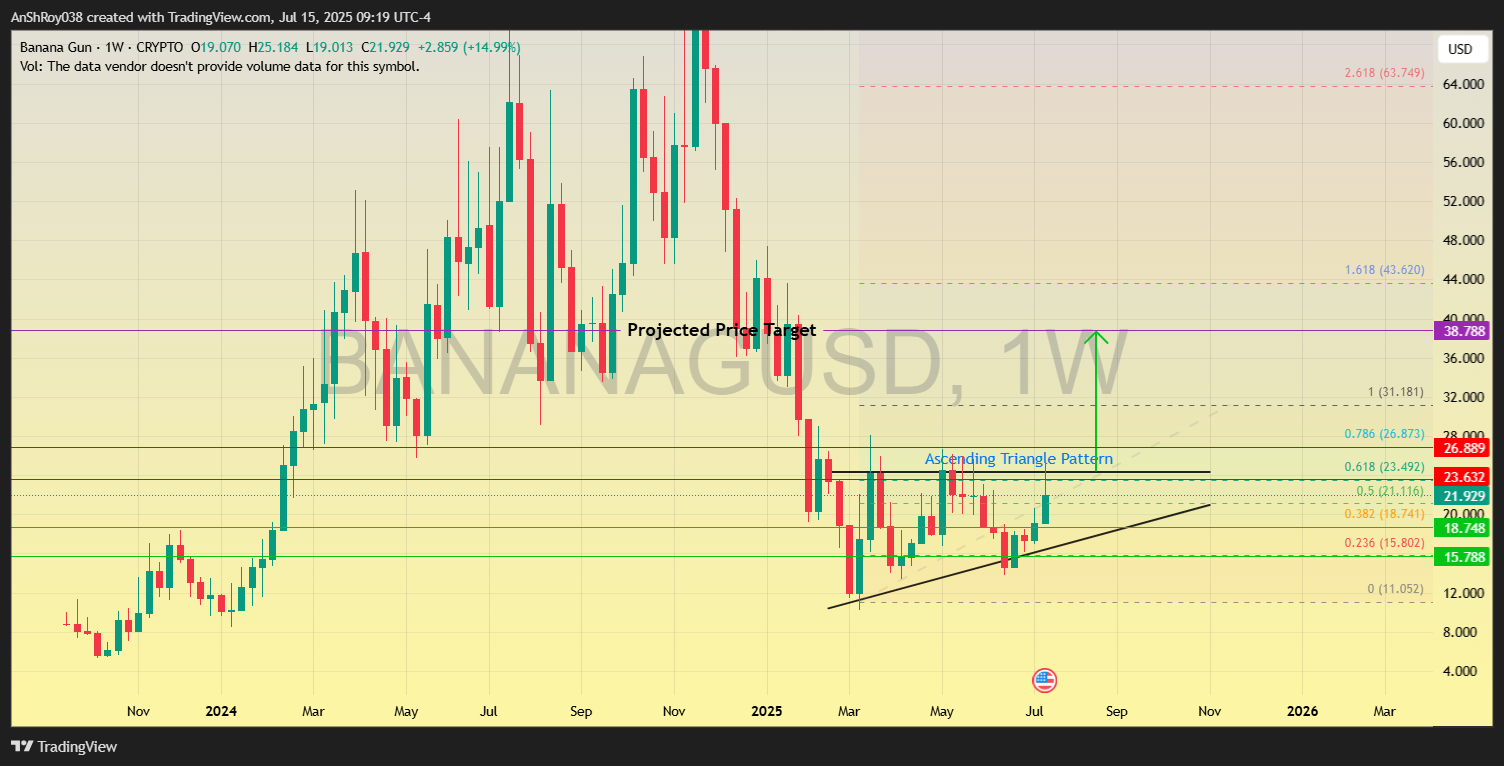
Since March, the price has respected the ascending baseline, forming a consistent uptrend in local lows. Weekly closes have inched closer to the horizontal resistance band, signaling imminent pressure buildup. BANANA’s latest close above $21.27 strengthens the bullish case, especially with confirmation volume beginning to rise.
Under classical technical analysis, the price objective of an ascending triangle is projected by measuring the formation’s height at its widest point and applying that distance from the breakout level. The resulting upside target aligns with the horizontal resistance level near $38.78.
Key resistance lies at $23.63. Flipping that would put the $26.88 barrier into focus. Sustained momentum beyond that opens the path toward the projected level of $38.78. A failure to reclaim $23.63, however, would delay the breakout structure and potentially trigger short-term profit-taking.
Additionally, rejection could force the Banana coin price to test the support near $18.8. Failure of the immediate support would result the support level near $15.78 coming into play.
