Key Takeaways:
- The number of Shiba Inu unique addresses dropped for the first time in months.
- Analysts predict a major fall for the meme token, similar to DOGE’s decline between May-June.
- Meanwhile, SHIB prices continue to be in a downtrend, dropping 27.5% in the week starting Nov 15.
NEW DELHI (CoinChapter.com) — The meme token Shiba Inu seems to have fallen out of favor with the bulls.
After losing 6.69% of its value last week, SHIB prices are down 27.5% between the week’s high ($0.00005596) to low ($0.00004052) levels. In addition, the number of unique addresses holding Shiba Inu dropped for the first time in the last three months.
At present, the number of Shiba Inu token holders is 985,771, a significant decrease from 992,986 addresses it reached on Nov 15. Furthermore, as the crypto market fell over 6% on Nov 16, the number of Ethereum addresses holding SHIB fell to 968,871 in a day.
More than 24,000 SHIB addresses emptied their wallets within 24 hours. However, the numbers have since increased, leaving bulls hopeful of SHIB reaching the milestone of 1 million unique Shiba Inu addresses. It is important to note that the data only reflects addresses on the Ethereum network and not individual holders.
Analyst Believes SHIB Is Not A ‘Good Boi’
Meanwhile, as per Bloomberg’s Intelligence Commodity Strategist, Mike McGlone, Shiba Inu could be in for some rough times ahead. In a recent Bloomberg report, the senior strategist stated Shiba looked like an “example of excesses among 13,000 cryptos.“
Recommended: Shiba Inu (SHIB) coin continues to struggle despite CoinGate listing.He also speculated that the memecoin risks a pullback that would bring SHIB prices down to levels it last saw before its recent parabolic rise. According to Mr. McGlone, Shiba Inu’s recent rise to a $40 billion market cap (in Oct) puts SHIB at similar risk as Dogecoin in 2021 second quarter.
DOGE went from a high of $0.739 in May to a low of $0.163 in June, a fall of nearly 78% in 45 days. According to the Bloomberg analyst, Shiba Inu is likely to go down the same route. The meme token gained 830% in Oct but is down nearly 30% in Nov.
He further criticized the meme token, saying Shiba Inu is a mixture of ‘exploitation, good marketing, ESG, supply [versus] demand economics and gambling.’
Our graphic depicts risks to the broader market, with gravity likely to overcome Shiba Inu. When the Shiba Inu game is up, the problem we see is that many assets could be prone to risk-off sentiment
Bloomberg Crypto OutlookMeanwhile, Shiba Inu failed to react to an early Wednesday whale buy, in which a single wallet purchased more than 170 billion Shiba Inu tokens, worth approximately $8 million. However, the memecoin’s price action chose to lie down and play dead.
Shiba Inu Price Charts
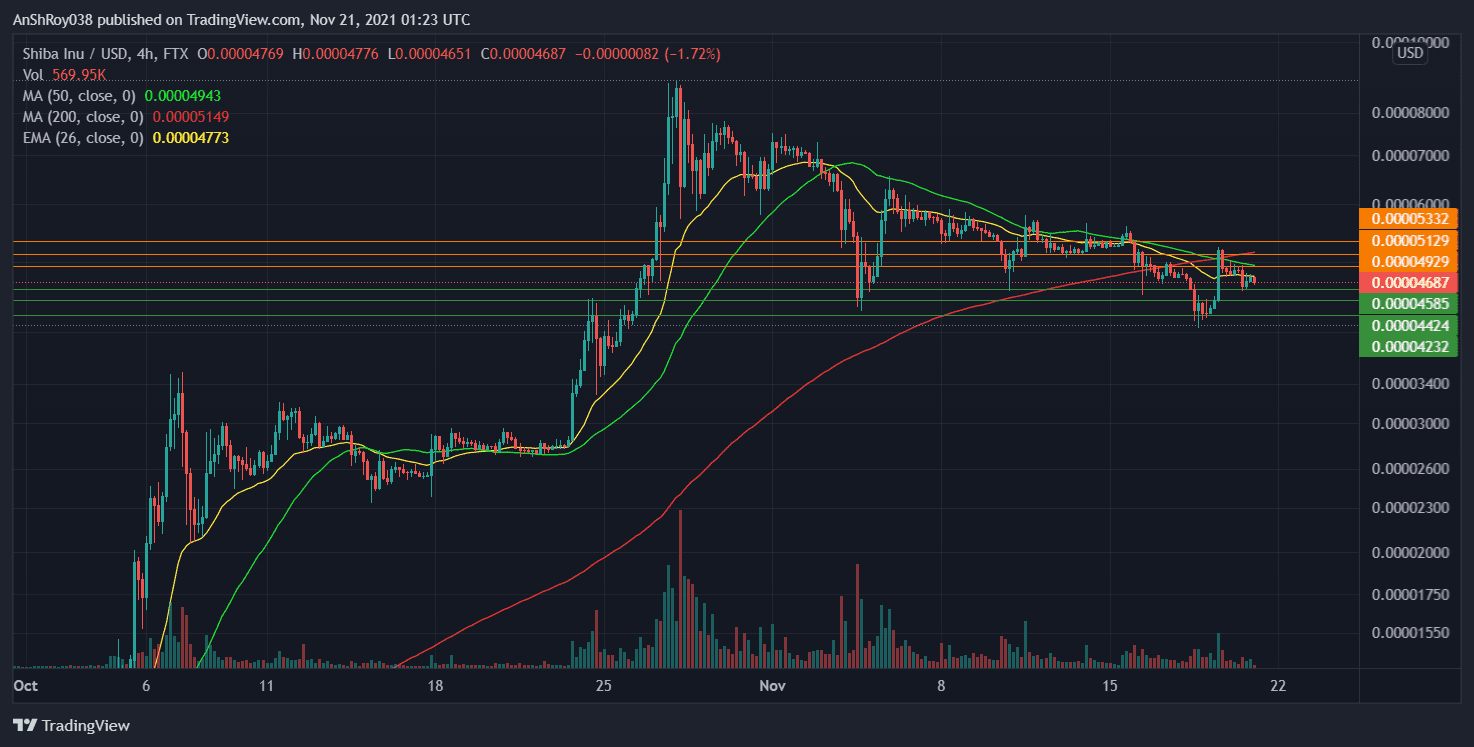
Shiba Inu prices are bearish across all time horizons on the 4-Hour (4H) charts. SHIB has immediate resistance at $.00004929, near the 50-4H moving average trendline. Further resistance comes from the 200-4H MA line at $0.00005129.
If Shiba Inu manages to jumpstart a bull run, prices could reach $0.00005332 before any pullback occurs.
Also Read: Shiba Inu price eyes bullish triangle breakout after whale buys 171B SHIB tokens.On the other hand, a further downside movement could see prices fall to $0.0000455. Then, if retail traders look to profit, a sell-off could see prices move below immediate support to reach $0.00004424. Finally, sustained selling pressure would likely see prices move to $0.00004232 before recovering.
Meanwhile, trend-based momentum oscillator MACD is bullish for SHIB on the 4H charts. However, bars on the MACD histogram, which plots the difference between the MACD line (difference between 12-4H and 26-4H EMA) and the MACD signal line (9-4H EMA of MACD), are decreasing in magnitude.
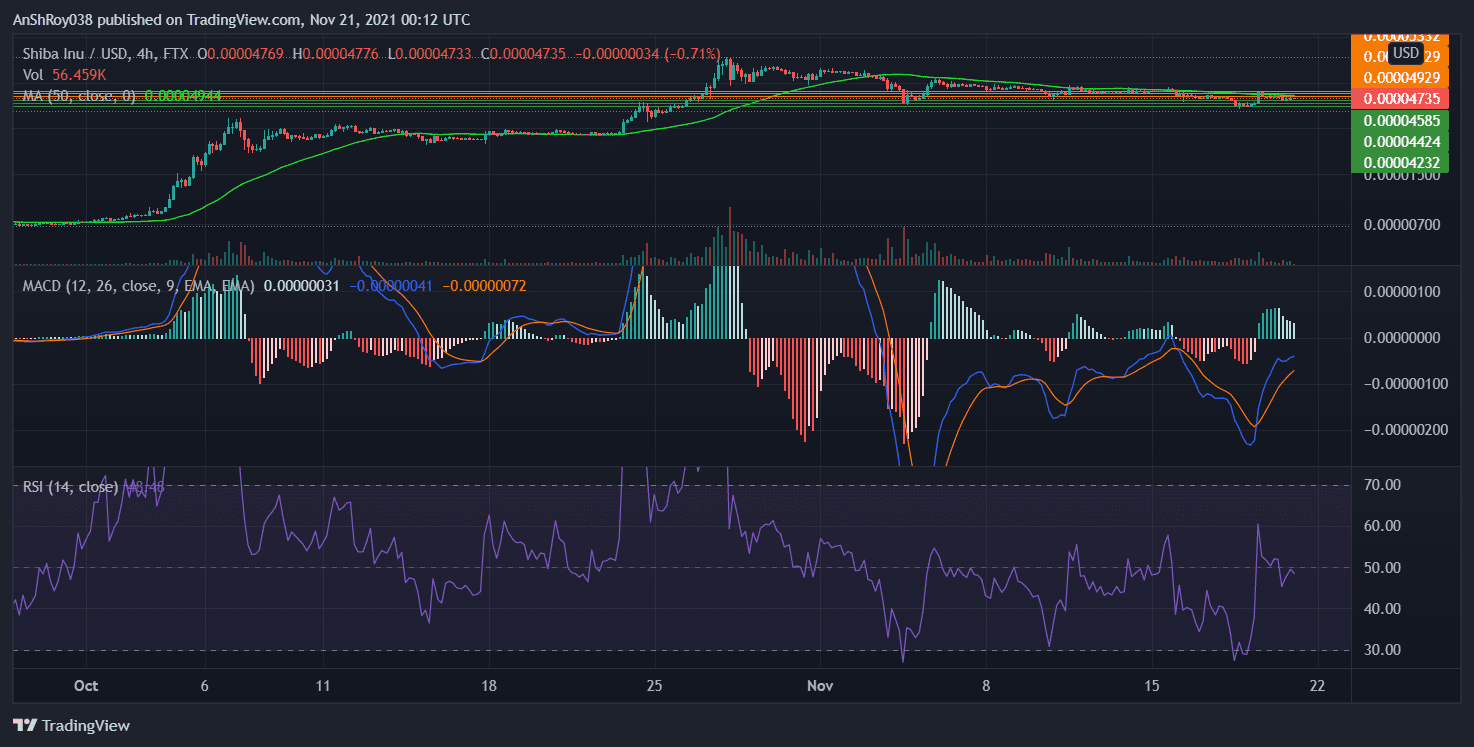
The decreasing bars indicate the MACD line is moving down towards its signal line and may soon chart a bearish crossover by moving below it. In addition, the relative strength index is neutral for SHIB, clocking a value of 48.48 on the 4H charts.
At the time of writing, SHIB was trading at $0.00004641, down 2.60% on the day.

… [Trackback]
[…] Find More Information here on that Topic: coinchapter.com/shiba-inu-holders-decline-as-shib-prices-fall-for-the-third-consecutive-week/ […]
… [Trackback]
[…] Find More on to that Topic: coinchapter.com/shiba-inu-holders-decline-as-shib-prices-fall-for-the-third-consecutive-week/ […]
… [Trackback]
[…] Find More on that Topic: coinchapter.com/shiba-inu-holders-decline-as-shib-prices-fall-for-the-third-consecutive-week/ […]