
Key Bitcoin indicators
- Bitcoin could hit $90,000 in the coming sessions even as the price falls by over 12% from its record high of nearly $67,000.
- Elliott Wave indicators predict the said outcome.
- Nonetheless, the risks of the price falling below $50,000 appear more imminent, according to the same bullish setup.
YEREVAN (CoinChapter.com) — A recent run-down in the Bitcoin (BTC) market has not dented its hopes to rebound sharply and test new record highs in the coming weeks.
At least, that is what Ed Crypto believes. In a tweet published Wednesday, the independent market analyst said that Bitcoin could rise back to $90,000, shifting from his earlier bullish target of $70,000.
The Elliot Wave setup
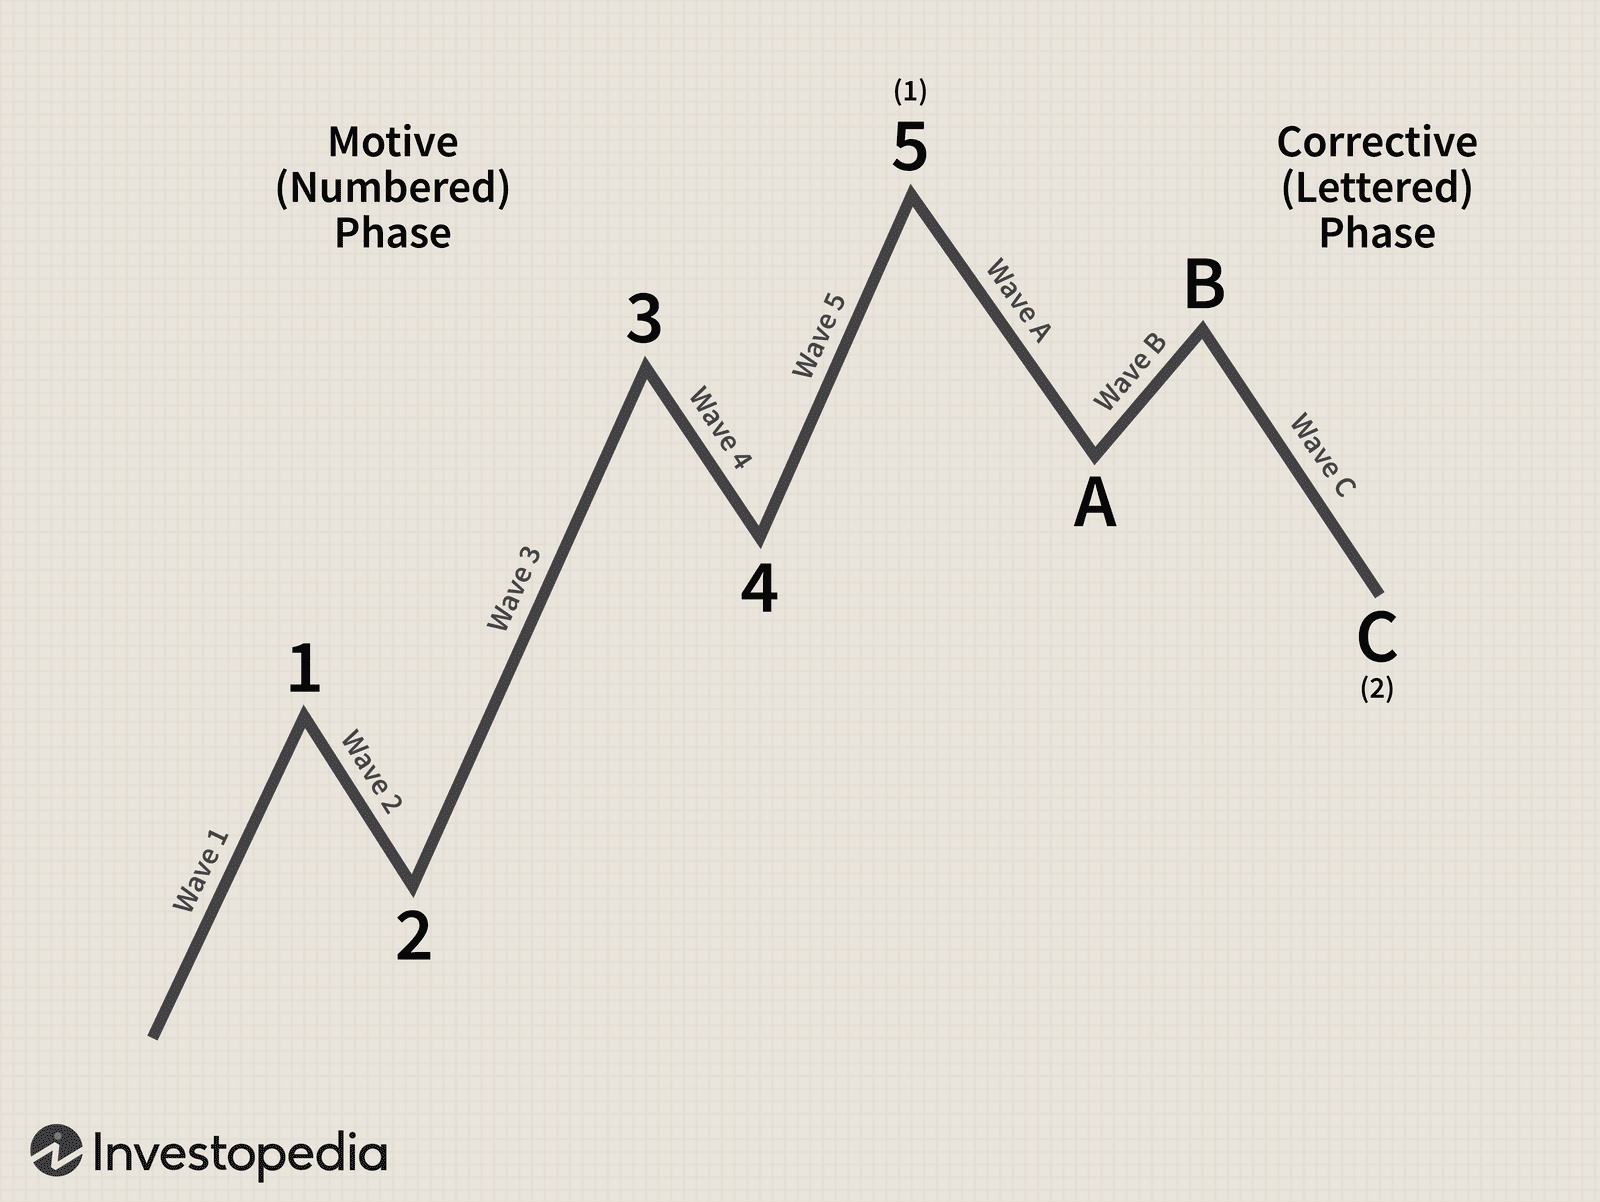
At the core of his improvised upside analogy lay a classic technical indicator dubbed Elliott Wave, consisting of five impulse waves followed by three corrective waves. As a result, Wave 1, 2, 3, 4, and 5 form an impulse, while Waves A, B, and C form a correction in the Bitcoin chart below.
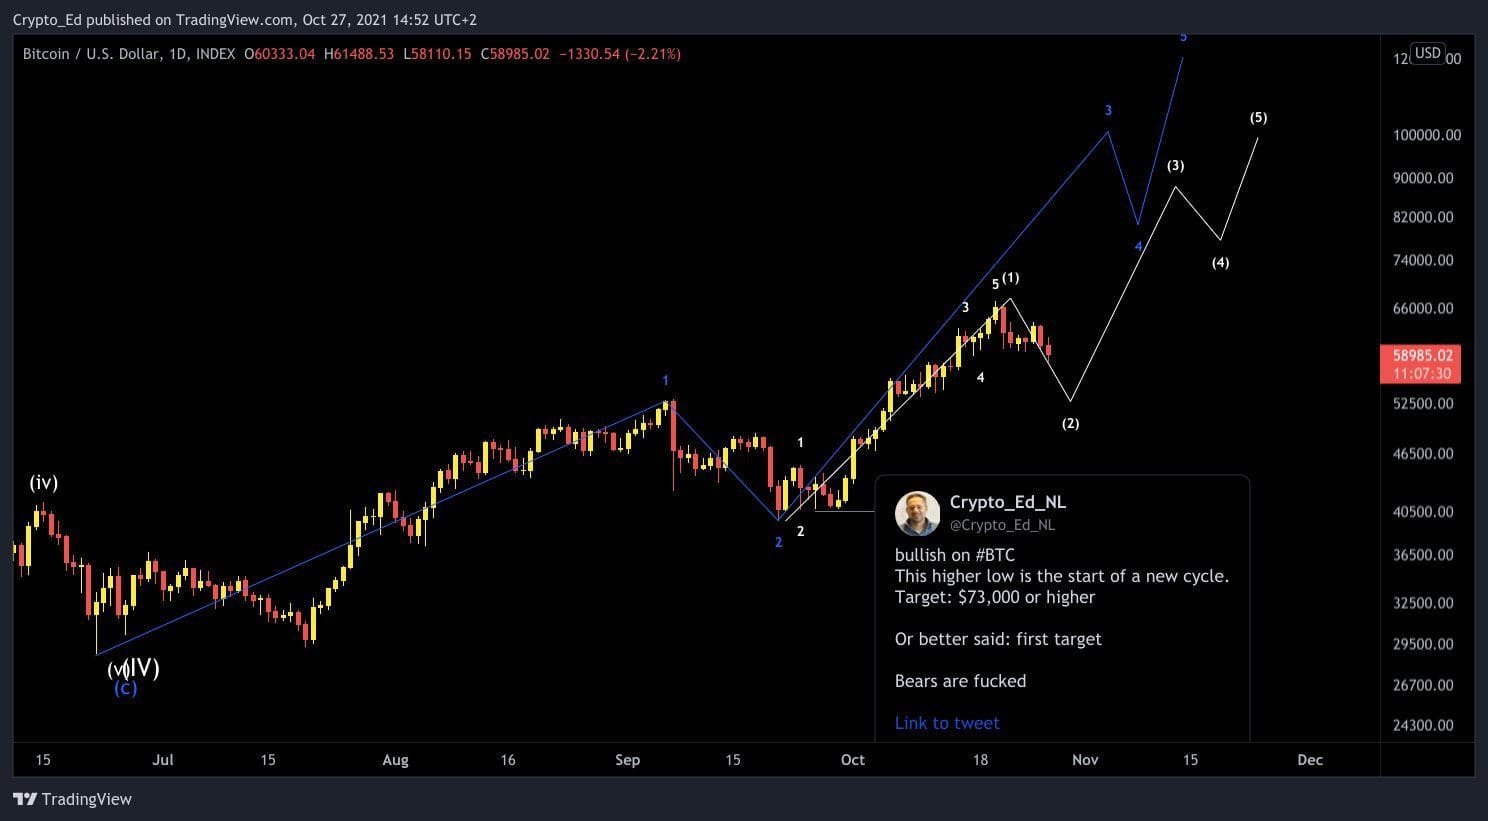
The previous Elliott Wave cycle finished sometime around $29,300 on July 20, 2021, marked by the letter ‘C.’ Then an impulsive rally followed suit, topping out near $53,000 on Sept 7, 2021, as it began another Elliot Wave cycle with Wave 1 (the blue-colored trajectory). Finally, it led to the formation of Wave 2 as the price corrected to $39,600.
Meanwhile, from Wave 2, a minor Elliot Wave cycle (white-colored) started, logging the 1, 2, 3, 4, and 5 impulse rallies.
But now, the price had entered the correction phase, forming A, around $60,000, and rebounding to B near $63,500. It now awaits a final correction towards level C, which, according to Ed Crypto’s chart (alphabets not marked), could be below $50,000.
Additionally, the Wave 5 of the previous Bitcoin cycle serves as Wave (1) of the next one (white-colored). As a result, a broader correction towards C acts as Wave 2 of the new cycle, promising a price run-up to 3, 4, and 5 ahead. Each of the levels promises a new record high for Bitcoin.
The Wave 3 of the blue-colored Elliott Wave setup and (5) of the white-colored Elliott Wave setup coincide near $100,000, one of the popular bullish bets in the Bitcoin market this year. However, Ed Crypto projects the said BTC price target near $90,000.
What other BTC indicators say?
The price targets shared by Ed Crypto somewhat coincide with other technical setups on the Bitcoin daily chart.
Related: Bitcoin (BTC) rises amid inflation-led US dollar weakeningFor instance, the BTC price has reversed directions after testing a rising trendline resistance that constitutes an Ascending Parallel Channel. That somewhat puts the cryptocurrency en route to the channel’s support near $48,276, also the 0.5 Fib line of the Fibonacci Retracement graph from $29,500-swing low to $67,000-swing high.
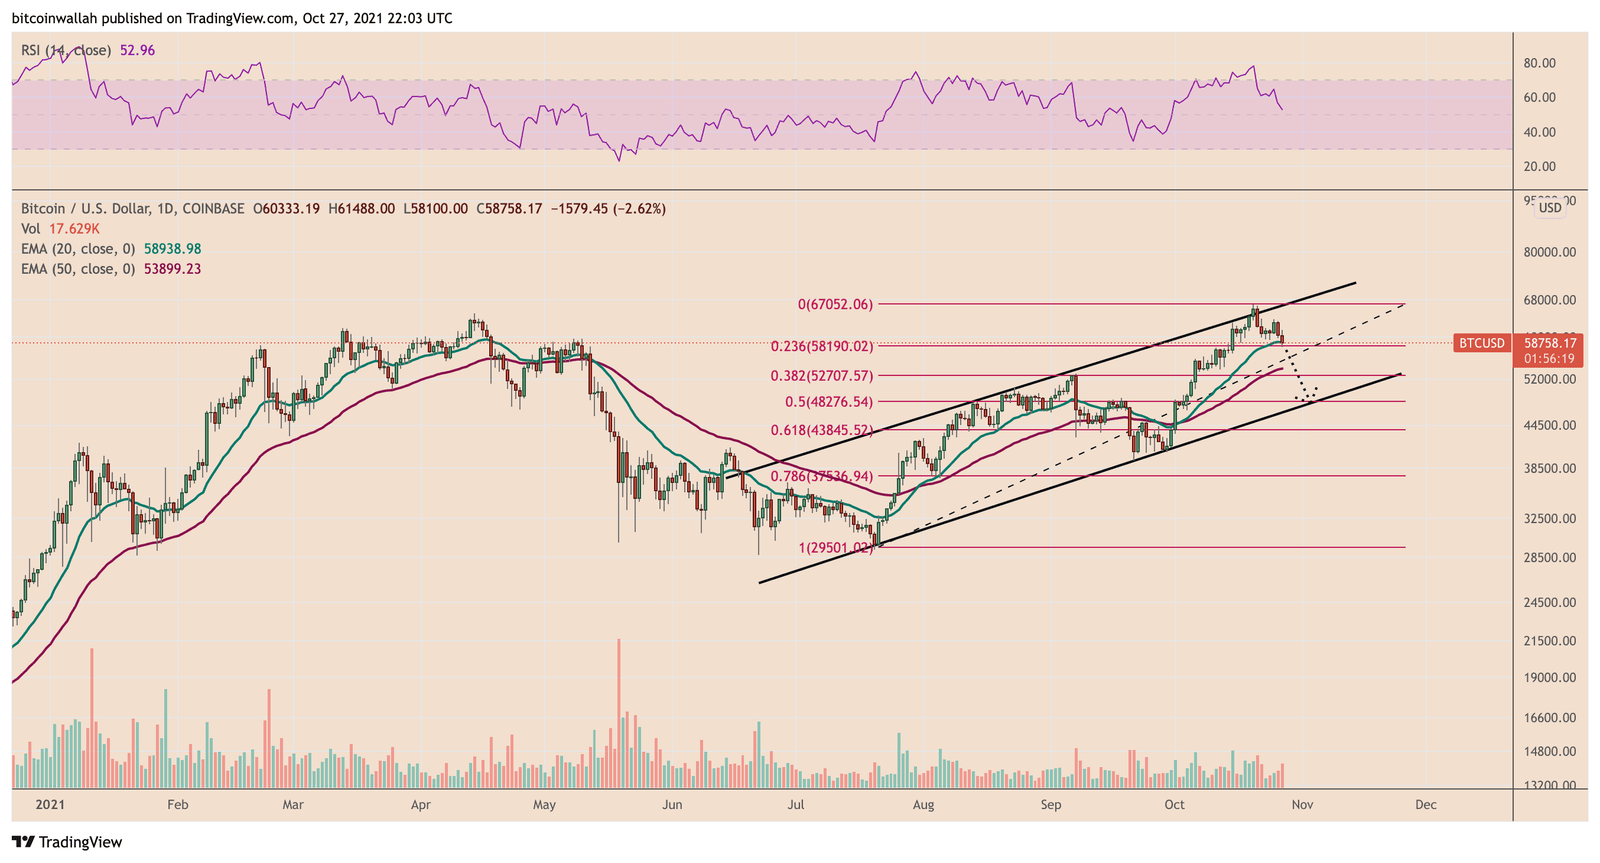
Additionally, the $48,276-level also comes near the Elliott Wave (2), as shown in the first chart above.

… [Trackback]
[…] There you will find 55657 additional Info to that Topic: coinchapter.com/bitcoin-analyst-shifts-70k-price-target-to-90k-after-btc-falls-12-in-6-days/ […]
… [Trackback]
[…] Here you can find 2784 additional Information on that Topic: coinchapter.com/bitcoin-analyst-shifts-70k-price-target-to-90k-after-btc-falls-12-in-6-days/ […]
… [Trackback]
[…] Find More Information here to that Topic: coinchapter.com/bitcoin-analyst-shifts-70k-price-target-to-90k-after-btc-falls-12-in-6-days/ […]