

PATNA (CoinChapter.com) — Bitcoin (BTC) prices, along with other riskier assets, slipped on Oct 28, just a couple of days after BTC price needled above $21,000 for the first time in a month. Meanwhile, Ethereum (ETH) prices nearly reached $1,600 before prices pared.
Meanwhile, analysts believe indicators might be suggesting that a Bitcoin bottom is nearly here. A community of crypto traders and analysts, Stockmoney Lizards, tweeted a comparison of Bitcoin price action between 2014-16 to its recent bear run since 2021.
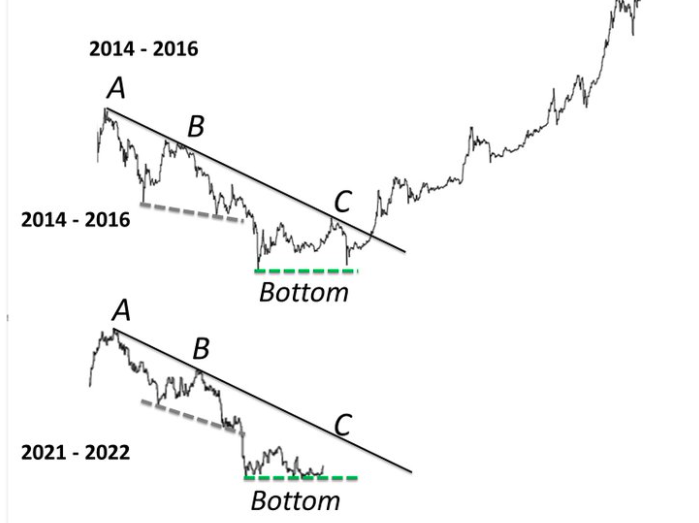
If the Lizards-people are to be believed, BTC price is moving inside a pattern reminiscent of what the prime crypto painted years ago. After breaking above the ABC trendline towards the end of 2015, BTC price started a bull run that saw the token gain over 6,900% by 2017-end.
While it will be too much to expect returns this time, likely because a 6,900% jump from current levels would mean a BTC price tag upwards of $1.4 million, the pattern might indicate an indicator of Bitcoin bottom.
However, Lizards-people spotting a historical price action is not the only indicator for forecasting a Bitcoin bottom. Other indicators indicate that BTC price’s ongoing downtrend might be bottoming out.
Massive Bull Runs Have Followed Low Volatility Periods
The volatility of the cryptocurrency market, and by extension, of Bitcoin, has reached very low levels. Bitcoin’s volatility is lower than most major stocks, stock indices, and even some currencies.

As an asset class, Bitcoin’s volatility has always remained higher than other asset classes like stocks. However, six times in the last 12 years, BTC price volatility has gone below that of the S&P 500.
Also Read: Crypto Price Prediction: Safemoon, Ethereum, MATIC, Algorand, LUNCUsually, the situation is a result of the stock market experiencing increased volatility while BTC price volatility remains relatively calm. Big moves in either direction often follow periods of low volatility.
Analysts categorized each day based on the percentile range of its volatility and then plotted BTC price 30 days forward from each day in each range.

As the chart shows, Bitcoin prices gave the maximum returns after breaking out of periods of extremely low volatility. Bitcoin has been moving inside the 5% to 10% low range of historical volatility, indicating an upside move might be coming soon.
Interestingly, though prices can break on either side, historically, BTC price breakout has been biased towards the positive side. Hence, it is safe to say that a breakout from current levels would likely start an uptrend.
Bitcoin’s Puell Multiple Inside Green Zone
The Puell Multiple is the ratio of the daily value of the issued coin (in USD) divided by 365-days MA of the daily value of issued coins in US dollars. The metric helps traders gauge the market cycle from a global perspective.
Simply put, Puell Multiple tells how much miners are currently making compared to the average of the last 12 months.

Historically, BTC price has bottomed out and started an uptrend whenever the Puell Multiple has reached the green zone between the 0.3-0.5 range. Moreover, the 100 MA of the Puell Multiple has bottomed out in those instances.
Bitcoin’s Puell Multiple has been in the green zone for most of Oct 2022.
The MVRV-Z Score
The MVRV-z score measures the ratio of the difference between an asset’s market cap and realized cap and the standard deviation of the market cap. The indicator assesses BTC’s overbought or oversold condition based on its market and fair value.
When Bitcoin’s market value crosses below the fair value, it indicates a market bottom

Historically, the MVRV-z has been in the green zone four times in the past, predicting a BTC price bottom each time. Bitcoin’s MVRV-z score has been in the green zone since Jun.
While you are here, here’s the latest on the tensions brewing between North and South Korea.

… [Trackback]
[…] Find More on that Topic: coinchapter.com/bitcoin-bottom-is-likely-here-say-analysts-and-indicators/ […]
… [Trackback]
[…] Information to that Topic: coinchapter.com/bitcoin-bottom-is-likely-here-say-analysts-and-indicators/ […]