
Bitcoin price started a fresh increase and cleared the $100,000 resistance. BTC is now consolidating and might restart its surge to a new all-time high.
Bitcoin Price Turns Green and Aims Higher
In the last few days, Bitcoin price saw a decent increase above the $95,000 resistance zone. The price surpassed a few key hurdles near the $98,000 resistance zone to enter a bullish zone. The upward move was such that the price settled above the $100,000 resistance zone and the 50-day simple moving average (blue).
There was a clear move above the 61.8% Fib retracement level of the downward move from the $109,590 swing high to the $74,501 low. The price tested the $106,000 zone and recently started a consolidation phase.
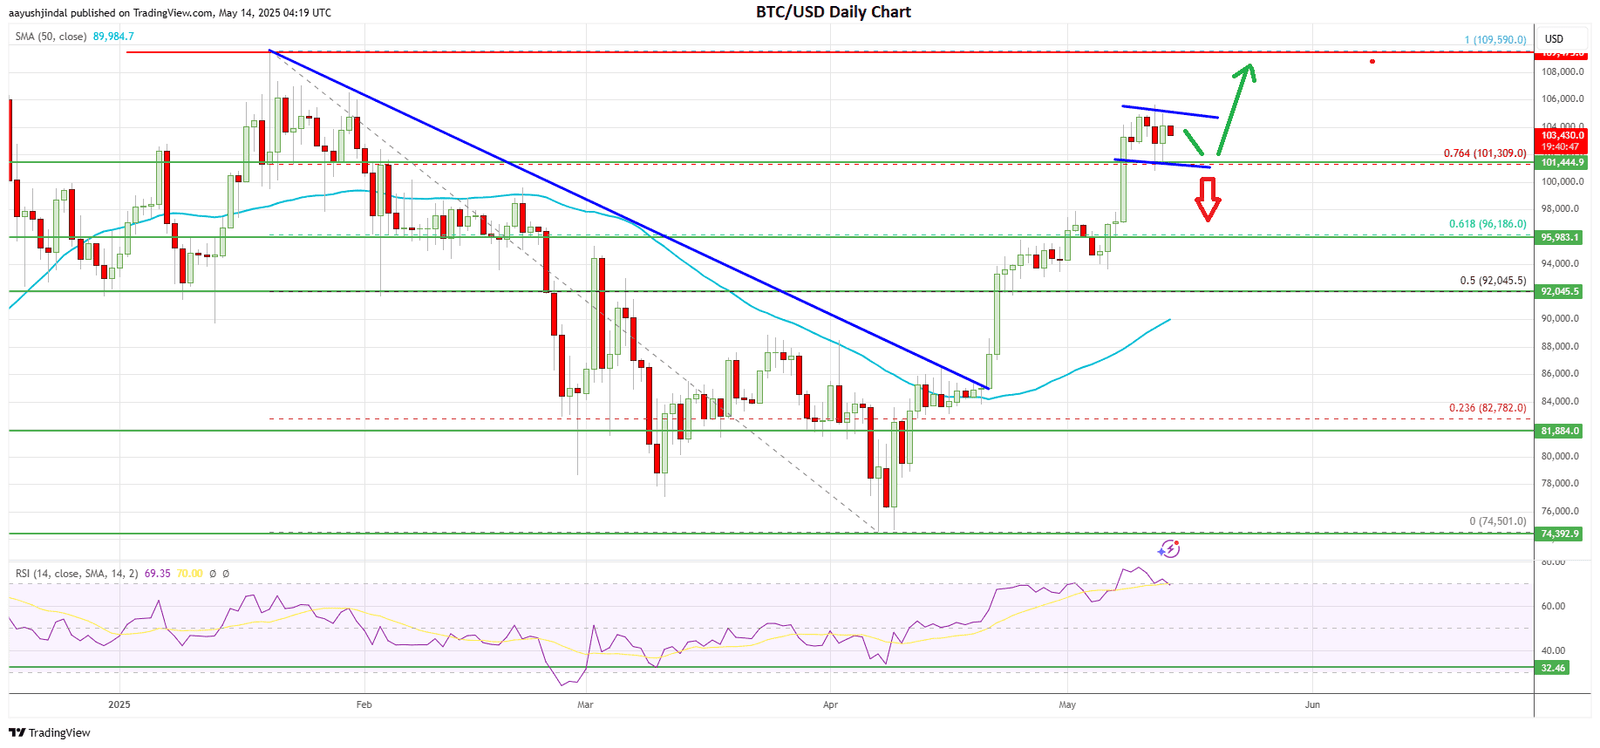
Bitcoin price is now trading well above the $100,000 pivot level, the 50-day simple moving average (blue), and the 76.4% Fib retracement level of the downward move from the $109,590 swing high to the $74,501 low.
These are all positive signs and suggest that the bulls could aim for a fresh increase. There is also a short-term bullish flag forming with resistance at $105,000 on the daily chart.
On the upside, immediate resistance is near the $105,000 level. The first major resistance is near the $106,000 level. The main resistance could be near the $108,000 zone. A close above the $108,000 resistance might spark more upsides.
The next stop BTC price could be the $112,000 level and a new all-time high, above which the price could rise toward the $113,500 level. A daily close above the $113,500 resistance zone could push the price toward the $115,000 level. Any more gains might call for a test of $118,000 since it is close to the 1.236 Fib extension level of the downward move from the $109,590 swing high to the $74,501 low.
Another Downside Correction In BTC?
If there is a downside correction, the price might find bids near the $101,200 level or the channel’s lower trend line. A downside break and close below the $101,200 support might spark more losses and send the price further lower. In the stated case, Bitcoin could test the $100,000 support.
The next key support could be $98,400. If the bulls fail to protect the $98,400 zone, the price could face heavy selling pressure. In the stated case, the price could test the $96,200 support. Any more losses might call for the test of the 50-day simple moving average (blue) at $90,000.
Overall, Bitcoin is showing positive signs and might soon attempt a move above the $106,000 resistance zone. If BTC dips, the bulls could protect the $98,400 support zone in the coming days.
