

- Persistent US Dollar strength hurting gold gains
- BTC bulls defend $35,000 support despite greenback gains
- Bitcoin in Wyckoff Accumulation Mode
Jaipur (CoinChapter.com) — The US Federal Reserve recently switched stances from dovish to hawkish, pushing gold to the losing end.
The yellow metal had enjoyed a solid bullish session comprising of April and May. As a result, global XAU/USD spot rates posted substantial upsides, achieving highs around the $1900 price level on June 1.
While this happened, the US dollar sank low. As a result, the US dollar index (DXY), which measures the greenback’s strength against a basket of other prominent fiat currencies, fared poorly in the first two months of the second quarter. From the local high of 93.4 points, DXY dropped down to 89.77 during the first week of June.
But now, the narrative has changed.
With the dollar regaining strength, thanks to the Fed’s decision at the last week’s FOMC meeting to tighten its monetary policy by the end of 2023, the XAU/USD rates have dropped to $1,749.50 for the first time since mid-April. That also marks gold’s worst recorded drop against the dollar since 2013.
The ongoing crisis in gold markets could also result from a “supposed end of paper-based price manipulation.” Crypto market commentator Anders L noted this in a tweet-based communication recently.
“Net stable funding ratio. It’s part of new banking regulations being implemented, called Basel iii. It will lead to a big change in how gold is treated. In short, it will be costly for banks to speculate in trading paper gold (unallocated gold), so that will likely end.”, he said.
Bitcoin holds gains despite a stronger dollar
Despite the recent dollar rally, Bitcoin managed to hold around the $35,000-level firmly.
Over the weekend, the flagship cryptocurrency logged an 18% jump from the lows near $30,000 to $36,773 in what appeared as a breakout move out of a classic bull flag formation. Meanwhile, DXY rallied from 91.639 to 92.140 in the same period.
Historically BTC dips when DXY moves up but Bitcoin bulls were non-chalant about the US dollar’s rally this time.
Commenting on the latest Bitcoin breakout, famous Twitter-based cryptocurrency analyst and educator “Income Sharks” said:
“If you own 1 $BTC and we make all-time highs, you can make $30,000+. If you own 1 $BTC and it drops to $20,000, you are only down $10,000, and it most likely comes back up. The risk to reward favors buying at these levels. We are closer to the bottom than the top, in my opinion.”
BTC in Wyckoff Accumulation Mode
VincePrince, a well-known TradingView based chartist, has provided another bullish boost for Bitcoin in his latest analysis. He observed the top cryptocurrency trading within a Wyckoff accumulation pattern.
Created by Richard Wyckoff in 1888, the pattern consists of two critical aspects: accumulation and distribution.
Also Read: Why this Bitcoin ETF continued accumulating BTC even amid selloffs?
An asset in accumulation signals bottoming out after a steep price drop followed by price rebounding to the upside. During distribution, the price moves downhill after achieving a top.
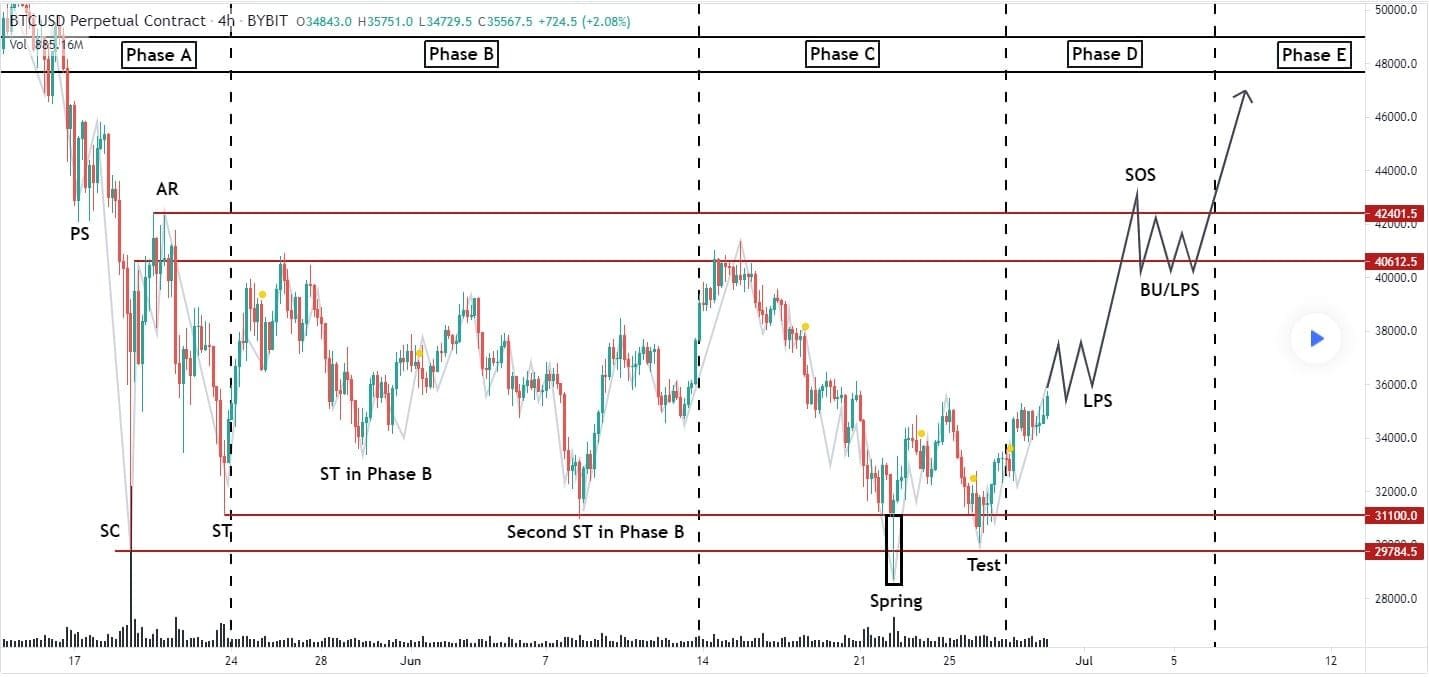
As pointed out by Vince, Phase A of Bitcoin’s Wyckoff trading pattern was marked by a FUD-filled selloff and a drop to the $30,000 price level. Then, with the market progressing further, BTC markets started giving “oversold vibes.” But, new buyers still entered even amid sustained bearish pressure.
Also Read: Are whales accumulating Bitcoin between $30K and $40K?
In Phase B of the pattern, most market participants still believed Bitcoin to test new lows. All while big players, whales, and institutions continued their accumulation spree. Selling supply remained and pushed BTC spot rates to the “second ST.”
Phase C saw Bitcoin test new support levels (shown by “spring”) lower than those established in phases A and B. But the selling supply was not enough to keep the bearish pressure on. Instead, deep-pocketed investors milked the opportunity and lapped up all available coins at drop-dead rates. According to Vince, “…it was actually the best zone to move into the market as it is in such a Wyckoff accumulation.”
Liftoff
The accumulation in previous phases is now showing up in Phase D, which Bitcoin currently is in. Despite the scanty thoughts of further bearishness lingering in the minds of traders, VincePrince notes:
In this Phase, the price-action shows actual SOSs (Sign-Of-Strength) and LPSs (Last-Points-Of-Supply) as marked in my chart, where the supply decreases and demand slowly begins to increase.
Phase D’s momentum will finally pave the way for Phase E, where bullish price action will carry on unabated. This Phase, as Vince puts it, will complete the Wyckoff accumulation pattern, which will lead to Bitcoin correcting upside with significant gains. Probably a reclaim of the $40,600 resistance and a further flight up higher.

… [Trackback]
[…] Find More on on that Topic: coinchapter.com/bitcoin-btc-holding-strong-above-usd-35000/ […]
… [Trackback]
[…] Information to that Topic: coinchapter.com/bitcoin-btc-holding-strong-above-usd-35000/ […]