

NEW DELHI (CoinChapter.com) — Bitcoin (BTC) might be looking at a bullish signal from a technical indicator that has historically preceded “massive” bull markets for the token, according to a crypto trader.
Going by the moniker “Teddy,” the trader singled out the Ichimoku cloud indicator, noting that the BTC price is close to breaking above the indicator. Teddy highlighted that a BTC price painted a strong rally “whenever Bitcoin broke the Ichimoku cloud on the monthly timeframe.”
Ichimoku Breakouts Might Be The Next Big Bitcoin Bullish Signal
Bitcoin price broke above the Ichimoku cloud twice since the crypto asset started trading. The Ichimoku Cloud is a technical indicator that consists of five lines.
The Tenkan Sen, or the conversion line (red wave), indicates short-term price movement, while the Kijun Sen, or the baseline (blue wave), shows medium-term trends and is less reactive to immediate price changes.

BTC price broke above the Ichimoku cloud for the first time in May 2016. A nearly 19-month-long rally followed, resulting in BTC price reaching an ATH (then) near $19,670 after spiking over 4,420% since May 2016.
The second time Bitcoin painted the bullish signal was in October 2020. The resulting rally lasted till November 2021 (with a few hiccups in between) and saw BTC price rise by nearly 565% to reach its all-time high near $69,000.
Teddy is anticipating a similar reaction if and when Bitcoin price breaks above the Ichimoku cloud, forming a bullish signal again. Furthermore, with markets expecting the US Federal Reserve to lead the pivot to a more dovish monetary policy, Bitcoin might see a price surge.
The recent launch of the spot Bitcoin ETFs has also riled up a frenzy for the digital asset. However, BTC price has not had the growth spurt that traders expected following its spot ETF launch, suggesting that the sector remains volatile and likely dependent on macro cues.
BTC Price Struggling To Move Back Above $44,000
Meanwhile, BTC’s price continues its struggle to reclaim the $44,000 per token price tag. The token plunged nearly 10% to a low near $41,500 during the Jan. 12 “sell the news” market rout. Traders cashed in on the hype surrounding the spot BTC ETF approvals, sending Bitcoin crashing.
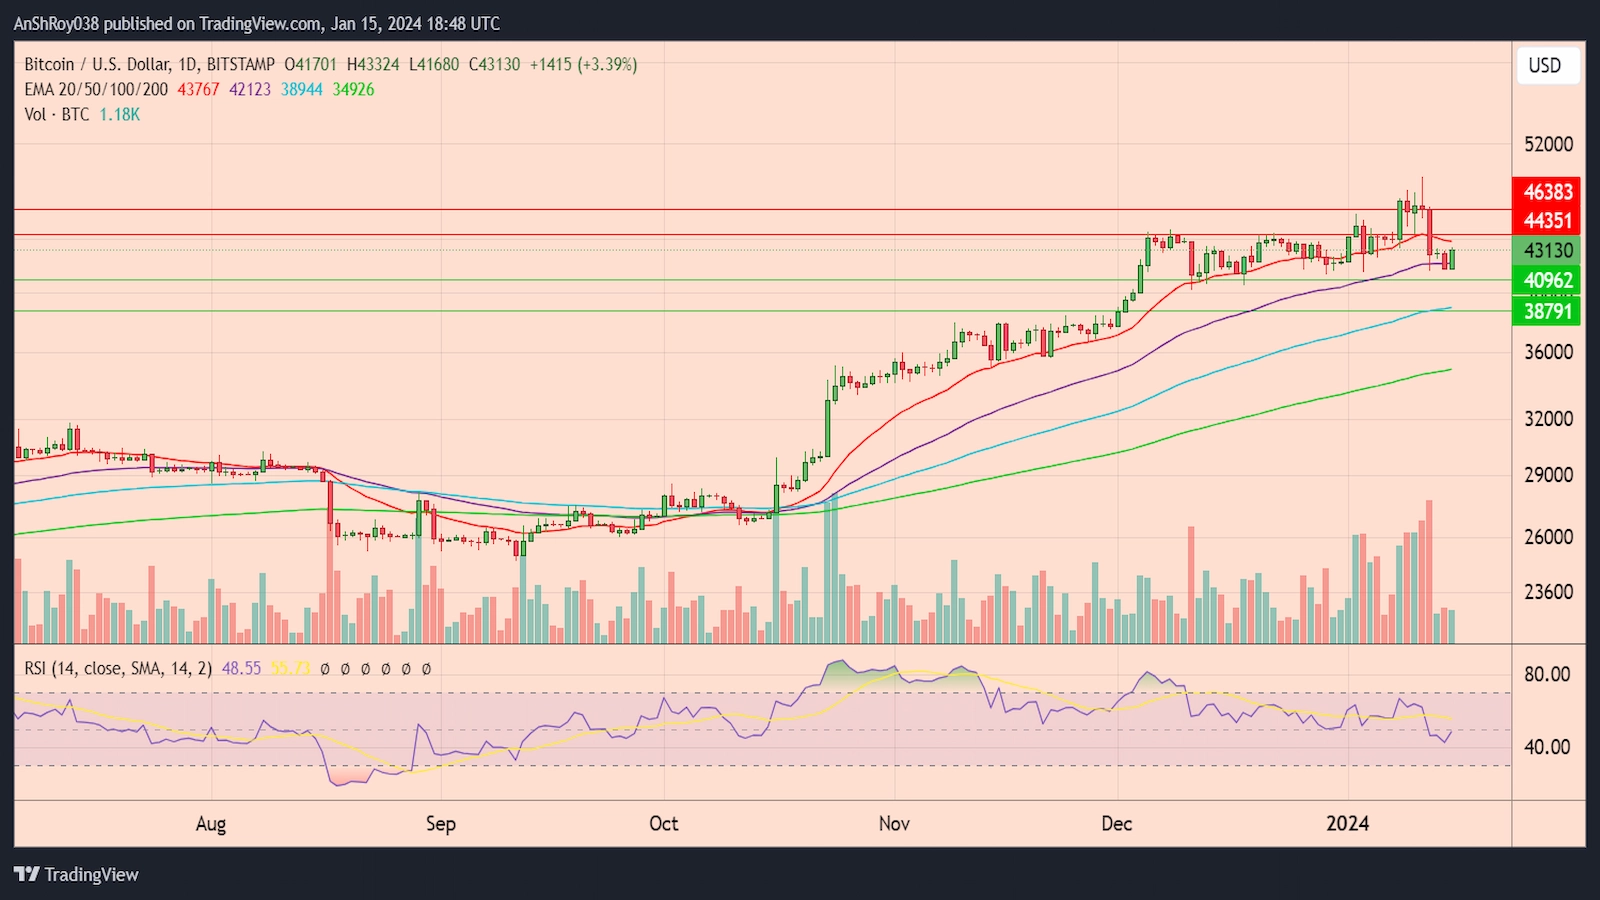
Despite rising nearly 4% on Jan. 15, Bitcoin price could only manage a daily high near $43,320. Bitcoin would need bullish signals to break above the 20-day EMA (red wave) resistance near $44,350 before targeting the resistance near $46,380 — and hit $50,000 ultimately.
Conversely, the BTC price could buckle under the selling pressure and drop to the support near $40,960. Moreover, breaching the immediate support might see Bitcoin dip to the 100-day EMA (blue wave) support near $38,800 before recovering.
The RSI for BTC remained neutral, with a score of 48.55 on the daily charts.

… [Trackback]
[…] Read More on that Topic: coinchapter.com/bitcoin-bullish-signal-50k-price-target/ […]
… [Trackback]
[…] Read More Information here to that Topic: coinchapter.com/bitcoin-bullish-signal-50k-price-target/ […]
… [Trackback]
[…] Find More on to that Topic: coinchapter.com/bitcoin-bullish-signal-50k-price-target/ […]
… [Trackback]
[…] Read More Information here to that Topic: coinchapter.com/bitcoin-bullish-signal-50k-price-target/ […]
… [Trackback]
[…] Find More to that Topic: coinchapter.com/bitcoin-bullish-signal-50k-price-target/ […]
… [Trackback]
[…] Information to that Topic: coinchapter.com/bitcoin-bullish-signal-50k-price-target/ […]