
YEREVAN (CoinChapter.com) – Bitcoin (BTC) traded at over $41,300 in Monday’s European session after weeks of sideways consolidation. However, some technical indicators point at a bearish continuation for the alpha crypto, which could take BTC to $30,000 or lower in the upcoming month.

BTC/USD weekly price chart spells trouble
The alpha crypto’s weekly chart hinted at painting a Death Cross between the 20-week exponential moving average (EMA-20; red wave) and EMA-50 (orange wave). The formation occurs when a short-term MA crosses below a long-term MA. As long as the latter remains dominant, BTC bears can expect profit.
However, the weekly price action also formed an Ascending Channel that could help Bitcoin reclaim its all-time high at $69,000. The setup features two parallel trendlines that have been relevant for over a year.

But to carry out a bullish prognosis, Bitcoin holders would have to double down on the trading volumes, which have been consistently low in the previous two months.
Moreover, the relative strength index (RSI; purple graph at the bottom) hinted at traders’ low expectations. In detail, the RSI is a momentum indicator, and typically it shows declining interest when charting below 50.
Also read: Bitcoin rallies over $41K after Fed raises interest rates — but a BTC selloff appears likelyAdditionally, the chart above showed a bearish diversion between the price action and the momentum, which could also lead Bitcoin into a correction. While the price printed higher lows, the RSI registered lower lows, confirming the bearish outlook.
Bearish daily chart
The daily chart backed Bitcoin’s grim prospects in unison with the most bearish weekly high time frame technicals. In detail, the BTC/USD price action painted a Symmetrical Triangle. The setup entails two converging trendlines: up-sloping support, and a down-sloping resistance, that enclose the price action and prevent sharp breaks in either direction.
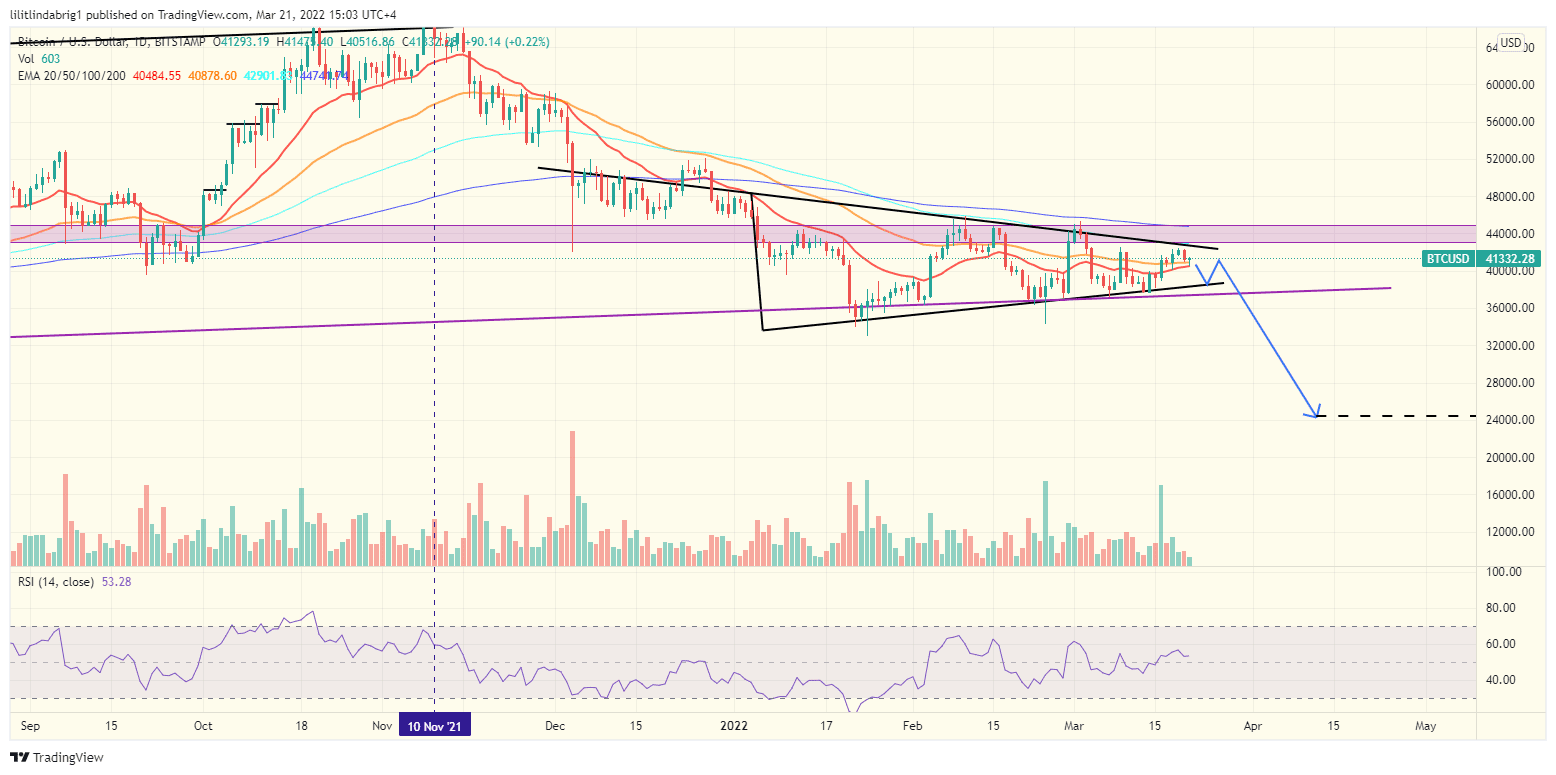
Also read: Bitcoin’s on-chain demand returns as BTC wobbles around $40K.AdditionallBitcoin’smmetrical Triangle is a continuation pattern, meaning when a token exhausts the setup, it will likely adopt the bias preceding the Triangle. Therefore, while forming the setup, Bitcoin lost almost 30% of its value since topping out on Nov. 10. Thus, the bearish formation could take BTC well below $30,000 in the upcoming month.

… [Trackback]
[…] Here you will find 96167 more Information to that Topic: coinchapter.com/bitcoin-death-cross-spells-more-trouble-as-btc-risks-decline-to-30k/ […]
… [Trackback]
[…] Find More here on that Topic: coinchapter.com/bitcoin-death-cross-spells-more-trouble-as-btc-risks-decline-to-30k/ […]