
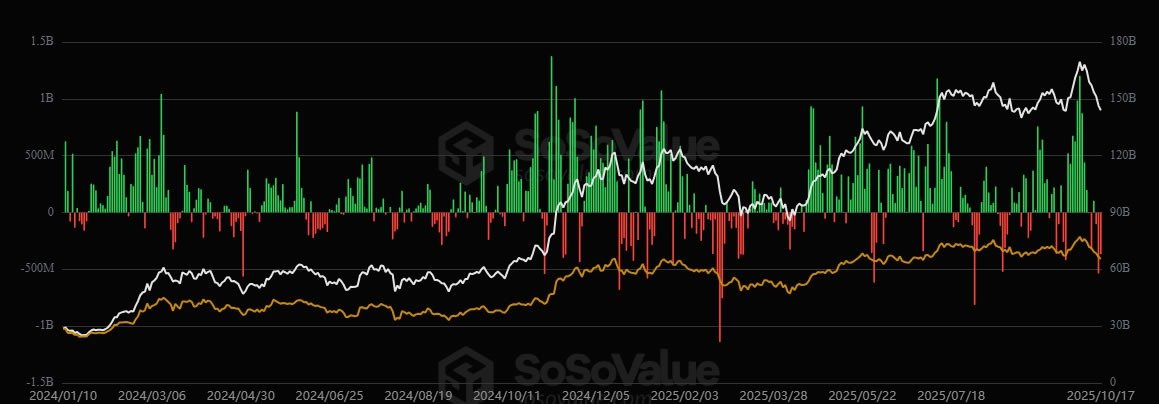
Spot Bitcoin ETFs in the United States recorded a net outflow of about $1.22 billion for the week. The red prints culminated on Friday with roughly $366.6 million leaving the products. The downdraft tracked a sharp move in the underlying asset through the same window.
Moreover, the week delivered only one small inflow day on Tuesday. Every other session showed net redemptions across the complex. Therefore, the five-day tally closed deeply negative despite stable prints for a few issuers late in the week.
At the same time, price action in Bitcoin set the backdrop. BTC fell more than $10,000 from above $115,000 on Monday to a four-month low near $104,000 by Friday. Consequently, ETF flows reflected de-risking into the weekly close.
Issuer-level breakdown
BlackRock’s iShares Bitcoin Trust posted the largest single-day outflow on Friday at approximately $268.6 million. This print drove most of the day’s total. As a result, the fund’s contribution dominated the aggregate move in the final session.
Fidelity’s product shed about $67.2 million on the same day. The outflow extended its own weekly retreat but at a smaller scale than BlackRock’s. Grayscale’s GBTC also saw redemptions near $25 million, continuing a slower bleed.
Additionally, Valkyrie registered a minor outflow on Friday. Other issuers reported zero flows for the day, which limited further deterioration into the close. Even so, the cumulative impact across the week remained firmly negative.
Price slide frames flows
The selloff in spot BTC coincided with investor redemptions from exchange-traded products. As prices retreated, some holders reduced exposure through the ETF wrapper. This behavior kept secondary-market pressure aligned with the primary trend.
However, the relationship is not one-to-one. ETFs can see redemptions for technical or portfolio reasons independent of price. Yet, the scale of this week’s outflows matched the depth of the market move, reinforcing a risk-off posture.
In parallel, intraday volatility stayed elevated around the lows. That dynamic often curbs fresh creations as market makers manage hedge costs. Therefore, creations slowed while redemptions accelerated, tilting the balance toward net outflows.
Schwab reports rising crypto ETP ownership
Charles Schwab presented a contrasting data point on client participation. CEO Rick Wurster said Schwab clients now own about 20% of all U.S. crypto ETPs. He described engagement as “very active,” citing a 90% rise in visits to the firm’s crypto site over the past year.
Furthermore, Schwab’s brokerage footprint gives those figures weight across a broad retail base. The firm already offers access to crypto-linked ETFs and Bitcoin futures. In addition, it plans to open spot crypto trading to clients in 2026, subject to its rollout timeline.
Therefore, even as this week’s flows turned negative, ownership concentration at a large brokerage suggests durable interest. Platform analytics and traffic trends indicate continued discovery and monitoring, separate from short-term risk shifts.

October seasonality breaks—so far
Historically, Bitcoin has posted gains in ten of the past twelve Octobers. This month, however, has slipped about 6% to date, according to tracking dashboards. The drawdown interrupts the “Uptober” shorthand that often circulates during this period.
Even so, seasonal patterns frequently hinge on the month’s second half. Past years have delivered stronger returns late in October, which keeps attention on the coming sessions. Rate-cut expectations also sit in the macro backdrop as a potential influence on risk assets.
Still, seasonality does not determine flows. ETF creations and redemptions respond to positioning, liquidity, and hedging costs in real time. As a result, weekly prints can diverge from monthly narratives until catalysts reset the balance.
What the week signals
This week’s $1.22 billion net outflow shows investors reduced exposure across several leading spot funds. The largest redemptions came from the biggest vehicles, amplifying the headline number. Price weakness in BTC aligned with the outflows and likely reinforced selling pressure.
At the same time, Schwab’s data highlights sustained engagement at a major retail gateway. Clients there hold a sizable share of U.S. crypto ETP supply, and platform interest continues to climb. Consequently, participation metrics and flows sent mixed signals: short-term de-risking alongside broader adoption.
Going forward, the calendar turns to late-October seasonality and macro rate expectations. These inputs can alter creation and redemption dynamics quickly. For now, the latest week records a clear outflow alongside a marked BTC drawdown, while brokerage engagement remains high.
RSI hits local lows as BTC retests $105K–$107K support
Bitcoin’s daily chart shows price probing the $105K–$107K support band while the RSI sinks toward late-cycle lows. The zone aligns with prior range highs turned support from May–June and with multiple reaction wicks highlighted on the chart. Therefore, the setup places BTC at a technically important shelf where buyers previously absorbed sell pressure.
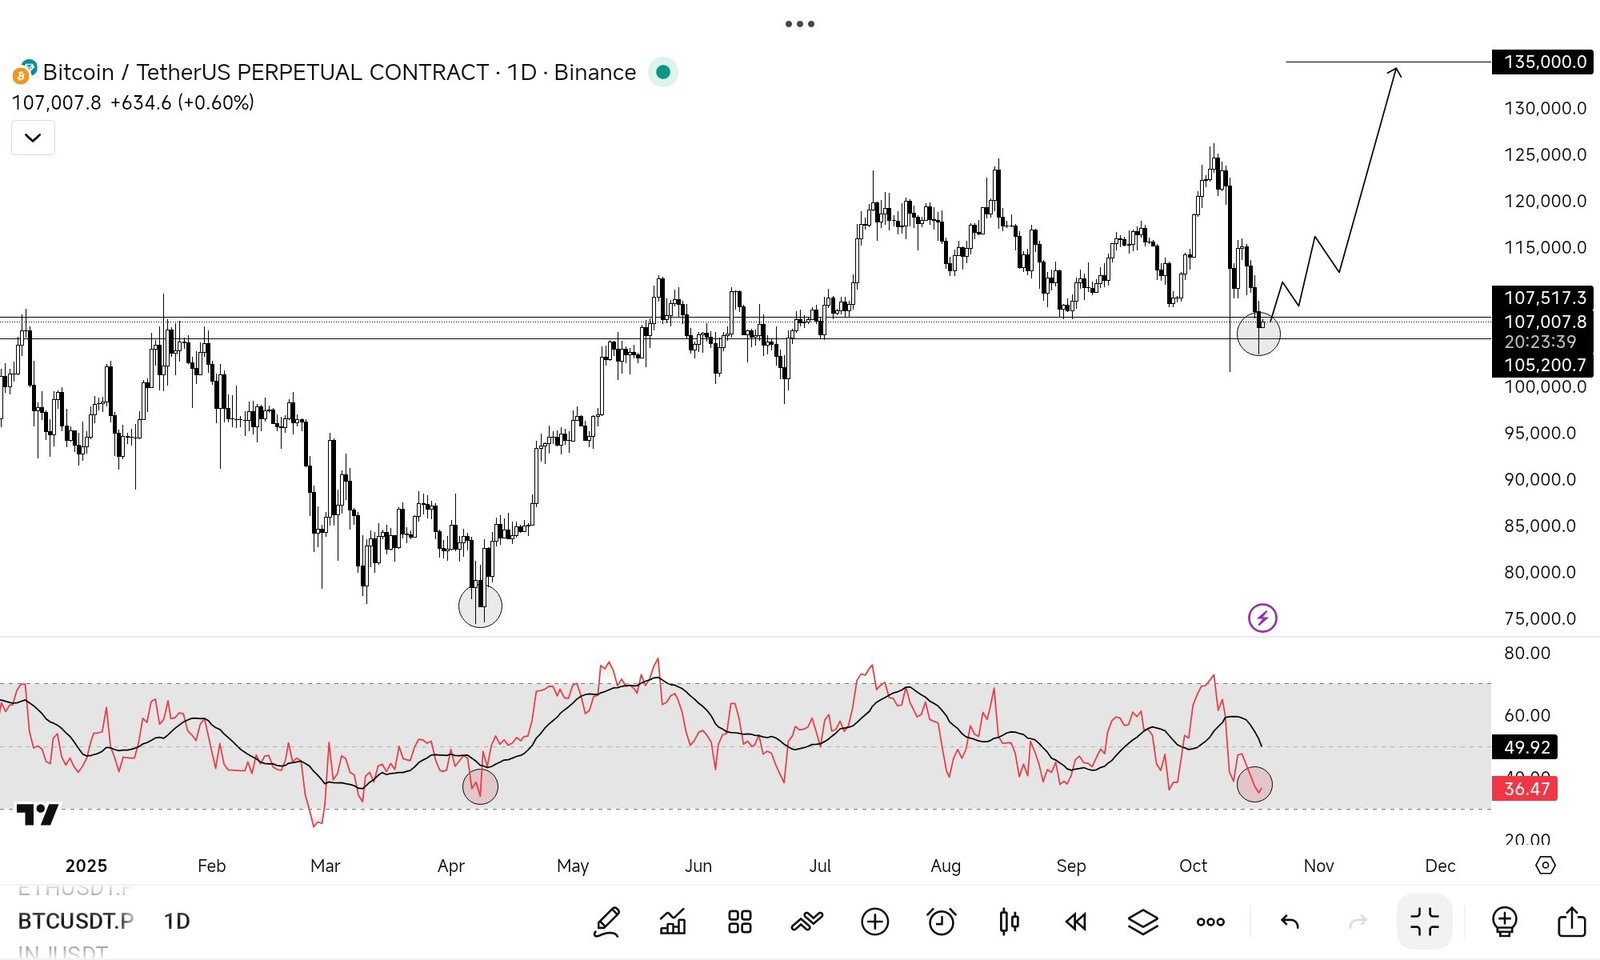
However, oversold alone does not confirm a bottom. Momentum remains below the RSI signal line, and structure prints a lower low versus early October. For a reversal, price would first need to reclaim the most recent breakdown area near $112K–$115K and then clear the cluster of lower highs around $120K. Those levels would flip trend back to neutral-to-positive on the daily timeframe.
Conversely, a decisive close below ~$105K would invalidate the shelf and expose the next high-volume node closer to $100K and the round-number liquidity beneath it. Until a reclaim or a breakdown appears, the chart signals inflection: support strength versus persistent momentum loss. In short, RSI is stretched, but confirmation still depends on how price resolves this support test.
