
NEW DELHI (CoinChapter.com) — The global cryptocurrency market recovered slightly even as Bitcoin (BTC) prices went below $38,000 for the first time since Mar 14 this year. However, BTC recovered as the day wore on, recovering above $39,000.
However, the recovery seems weak, and the crypto market would need to maintain its uptrend to increase investor confidence. Furthermore, Bitcoin needs to break away from its correlation with the traditional financial markets.
BAL/USD
AMM protocol Balancer prices bounced off their 50-day moving average (yellow wave) on Apr 25 to register intraday gains of 10.65%. However, the BAL token lost nearly as much (9.2%) on Apr 26, suggesting bears are aggressively selling on relief rallies.
Apr 27 saw BAL prices struggle to remain above the 50-day MA support. If the bears continue their sell-off, BAL prices could fall to immediate support from their 100-day MA (purple wave) near $13.8. A move below 100-day MA support would see Balancer prices test support near $13.2 before recovering.
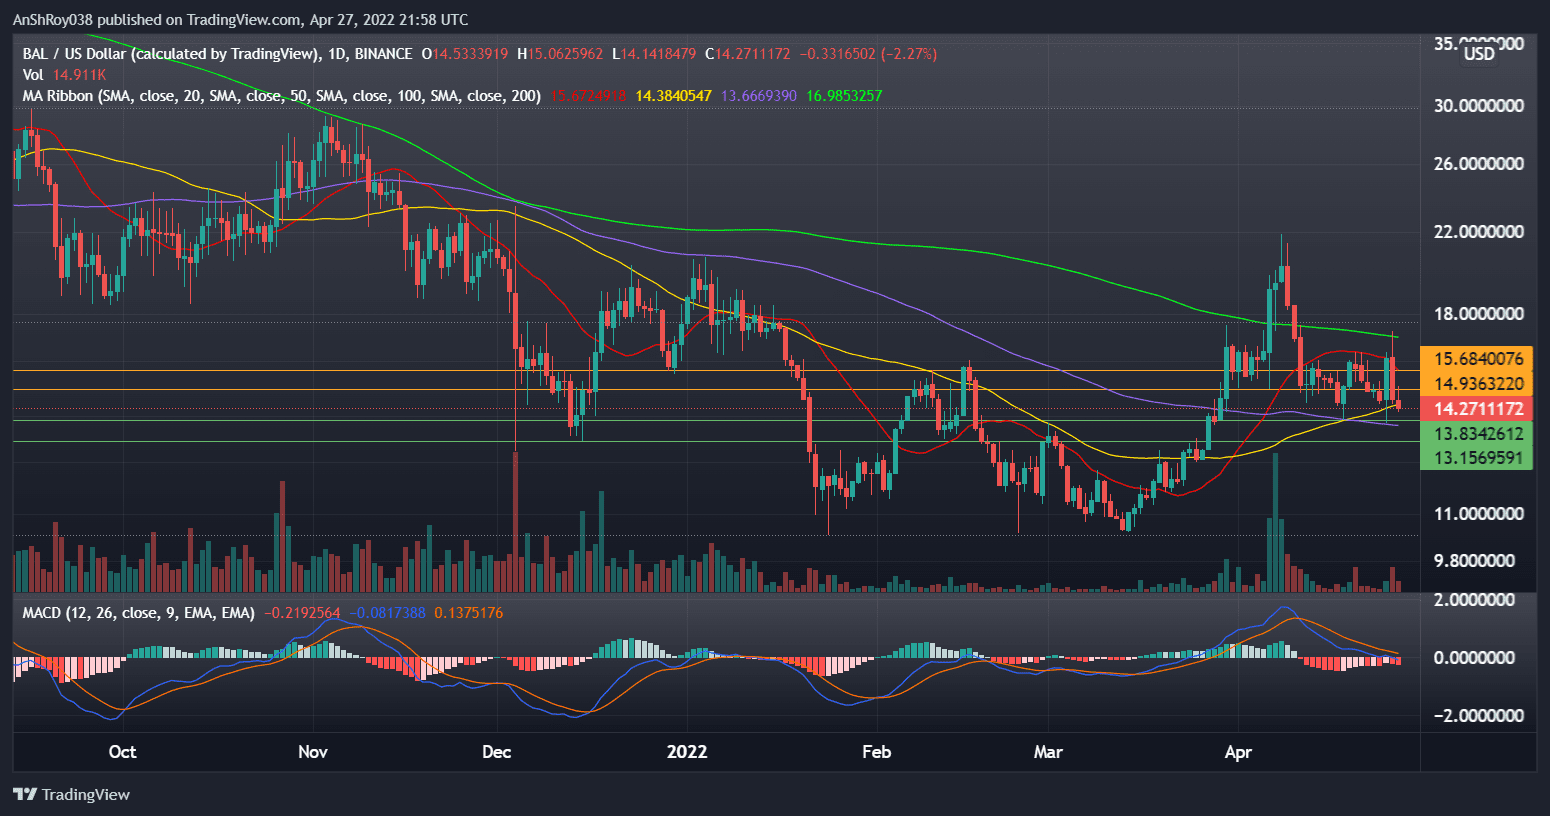
Conversely, if BAL rebounds from immediate support, the token would need to flip resistance near $14.94. A move above immediate resistance might see BAL prices target resistance from its 20-day MA (red wave) near $15.7.
Also Read: KAVA eyes 137% gains as it breaks out of bullish pattern.Meanwhile, momentum oscillator MACD remains bearish for the BAL token. Expanding MACD histogram bars suggest increasing bearish momentum for BAL price action.
SNX/USD
Synthetix Network’s native token SNX rebounded strongly 50-day moving average (yellow wave) to jump nearly 12% between the day’s low ($5.39) and high ($6.01) levels. The uptrend brought SNX prices to challenge immediate resistance near $6.
A sustained uptrend would likely see SNX prices flip immediate resistance to target resistance near $6.9 before correction pare gains.
Meanwhile, momentum oscillator MACD remains bullish for the SNX token. However, declining volumes seem to indicate reduced investor interest in SNX.
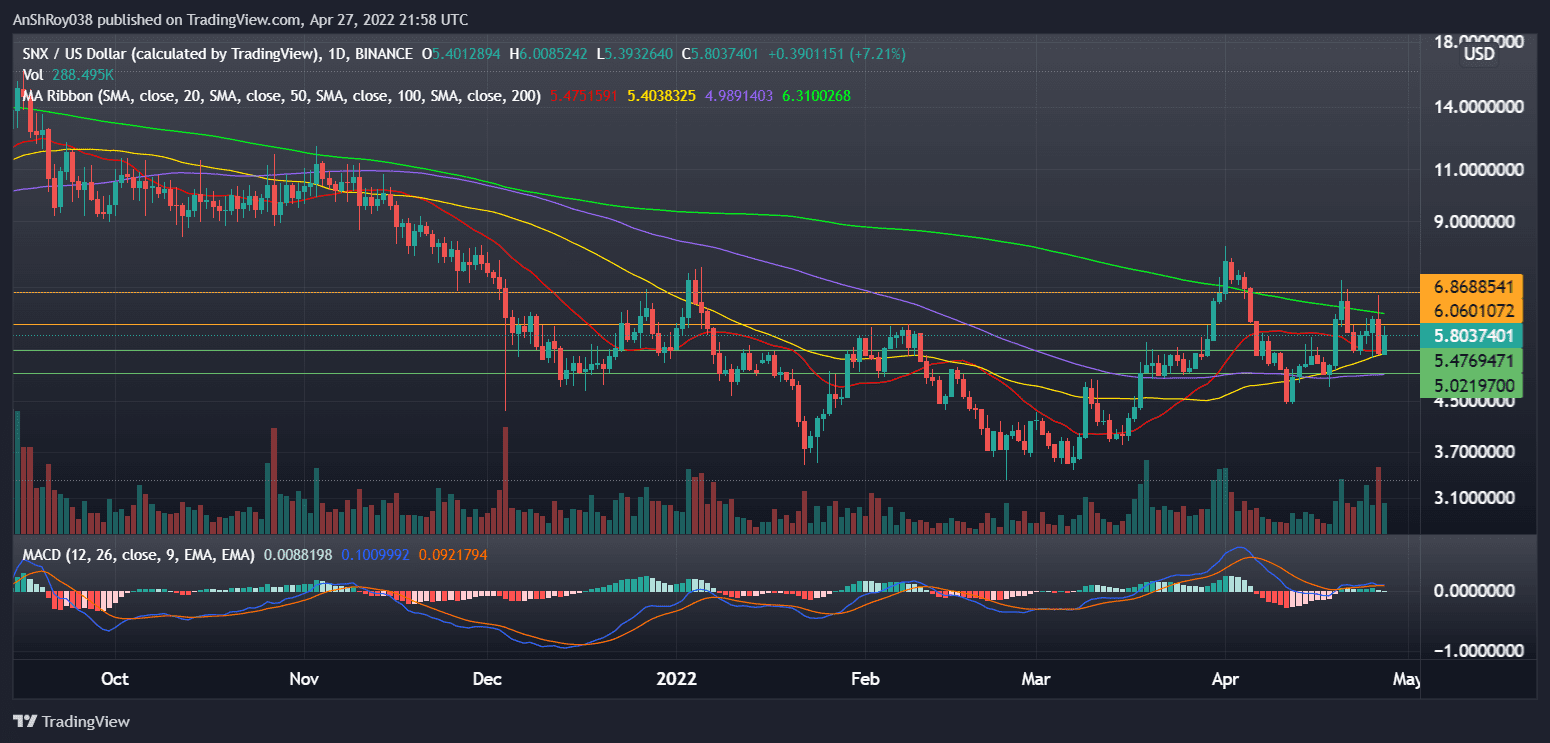
Meanwhile, momentum oscillator MACD remains bullish for the SNX token. Positive bars on the MACD histogram seem to be expanding, indicating strengthening bullish momentum for SNX. However, declining volumes seem to indicate reduced investor interest in SNX.
As such, if bears move in to profit from SNX’s recent uptrend, the token might test immediate resistance near $5.5. A marketwide sell-off might push prices to support from SNX’s 100-day MA (yellow wave) near $5.
NEAR/USD
Near Protocol’s prices have fallen nearly 30% in 9 days, moving from Apr 19’s $17.82 (high) to an intraday low of $12.44 on Apr 27.
Also Read: Bitcoin bobs around $39K as traders head for the hills liquidating $500M longs – what’s next?However, on Wednesday, the NEAR token painted its first green candle as NEAR prices bounced off of support from their 100-day moving average (purple wave) near $12.4. NEAR prices will test support near $11.7 before recovering if immediate support fails.
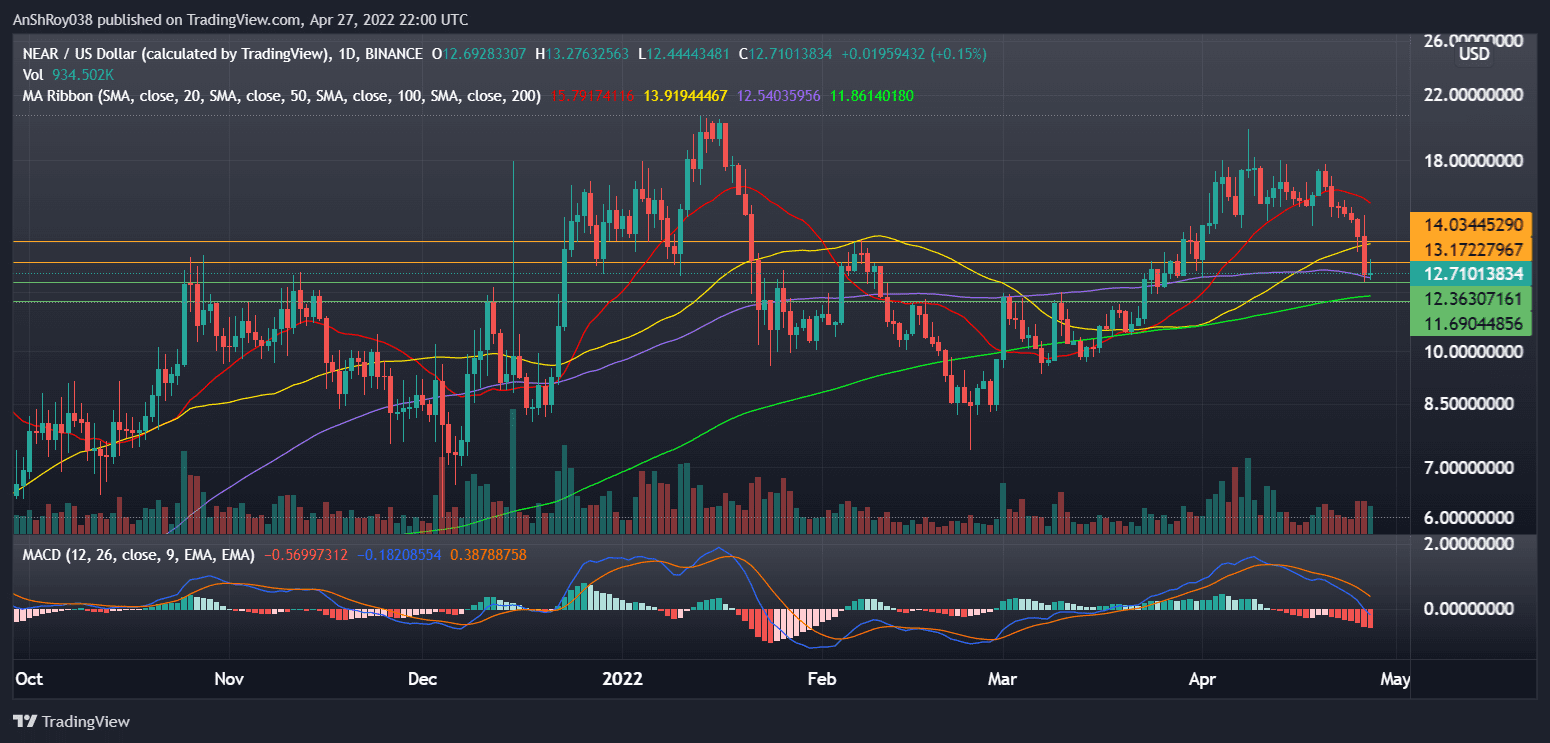
The momentum oscillator continues to forecast a bearish outlook for NEAR prices. In addition, negative bars on the MACD histogram are expanding, indicating that the MACD line (difference of 12-day and 26-day EMA) is moving further away from the MACD signal line (9-day EMA of MACD).
Conversely, if NEAR prices manage to start an uptrend, the token would likely flip immediate resistance near $13.2 before moving to challenge resistance from its 50-day MA (yellow wave) near $14.03.
GRT/USD
The Graph Protocol tried to recover from its 6.13% loss on Apr 26 as it jumped 12% between low ($0.331) and high ($0.373) levels on Apr 27. Moreover, the momentum oscillator MACD is slowly moving towards bullish levels.
Negative bars on the MACD histogram are contracting, indicating the MACD line (difference of 12-day and 26-day EMA) is moving towards the MACD signal line (9-day EMA of MACD) and may soon chart a bullish crossover.
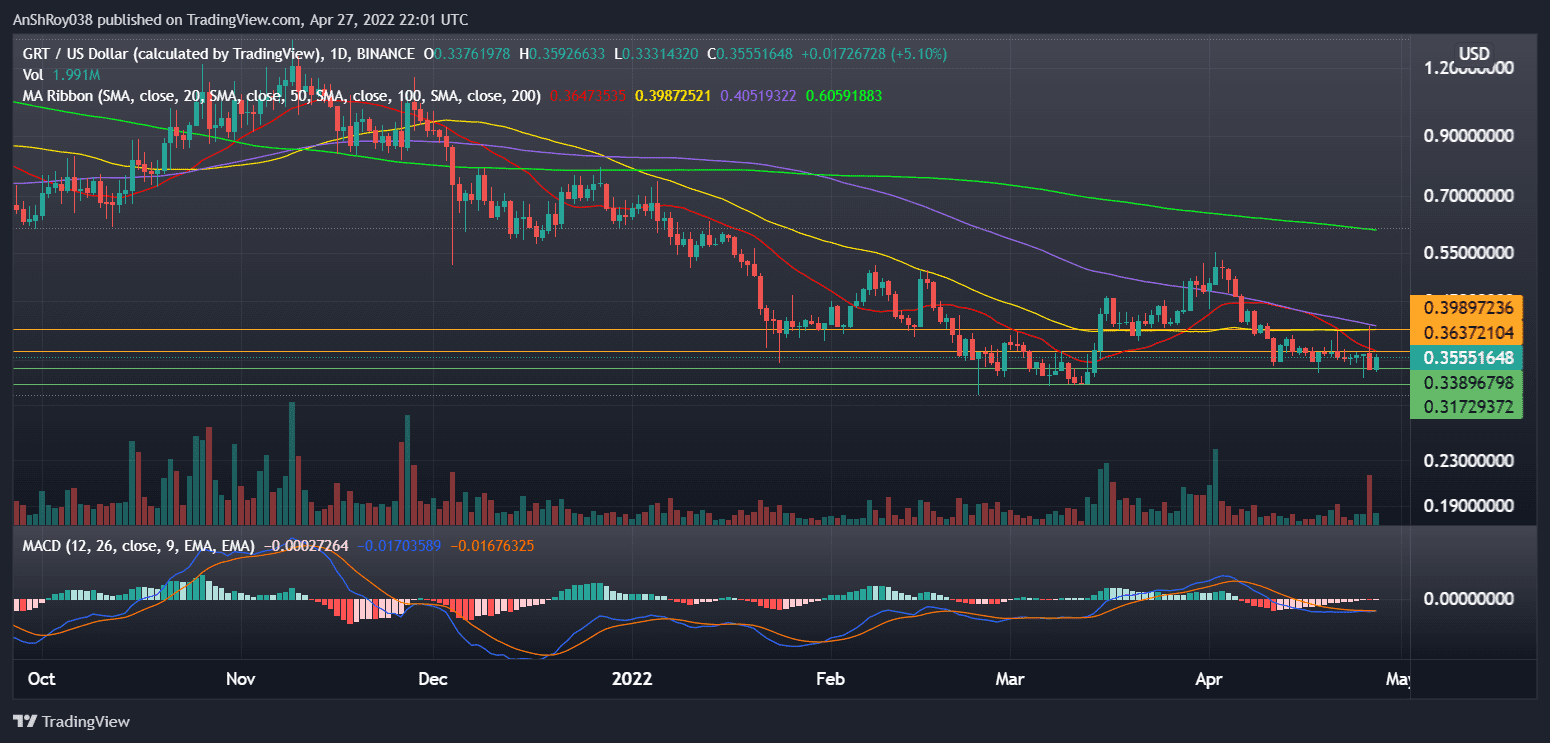
GRT prices would need to flip immediate resistance from their 20-day moving average (red wave) near $0.364 before moving to target the 50-day MA (yellow wave) and 100-day MA (purple wave) resistance confluence near $0.4.
Also Read: Ethereum’s place in the finance digitization space may help appreciate Ether prices.Conversely, if bears move to book profits, GRT prices would likely test immediate support near $0.34. Finally, a market-wide sell-off might push prices to $0.32 before the GRT token recovers.
PERP/USD
Perpetual contracts DEX Perpetual Protocol prices have been in free fall since mid-Nov. PERP prices are near their all-time low as the PERP token fell nearly 29% between Apr 20’s high ($5.05) and Apr 27’s low ($3.6).
If PERP prices continue to fall, the token will fall to immediate support near $3.55. Moreover, a market-wide sell-off could push prices to a new ATL near $3.32 before the GRT token recovers.
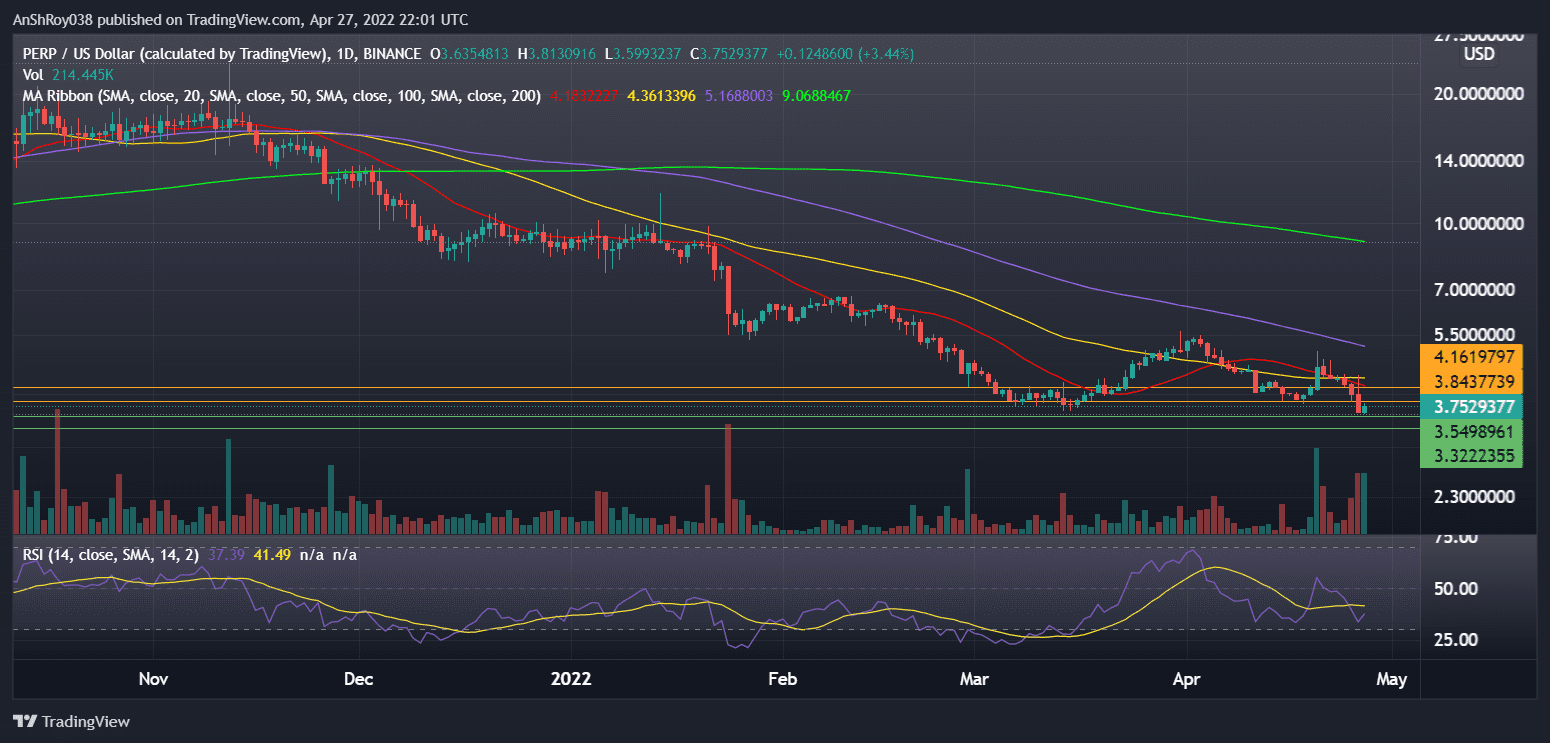
Meanwhile, the relative strength index for the PERP token sits neutral, with a value of 37.39 on the daily charts. If the RSI goes below 30, the PERP token will become oversold. Oversold RSI levels often result in a trend reversal favoring the bulls.
If PERP reverses its fortunes, PERP prices would need to flip immediate resistance near $3.84 to infuse confidence in investors. Moreover, a sustained uptrend would help PERP prices target resistance from its 20-day moving average (red wave) near $4.2.
DOGE/USD
Dogecoin took no time to reverse its fortunes after jumping nearly 20% on news of Elon Musk’s acquisition of Twitter on Apr 25. However, bears moved in the next day, as DOGE prices fell nearly 13% in the resulting sell-off.
Also Read: Dogecoin rallies as Elon Musk joins Twitter board of directors.DOGE prices started moving up again on Apr 27, but resistance from its 20-day moving average (red wave) near $0.141 rebuffed the memecoin’s uptrend. If DOGE prices flip the 20-day MA resistance, the token might target resistance near $0.148 before corrections pullback prices.
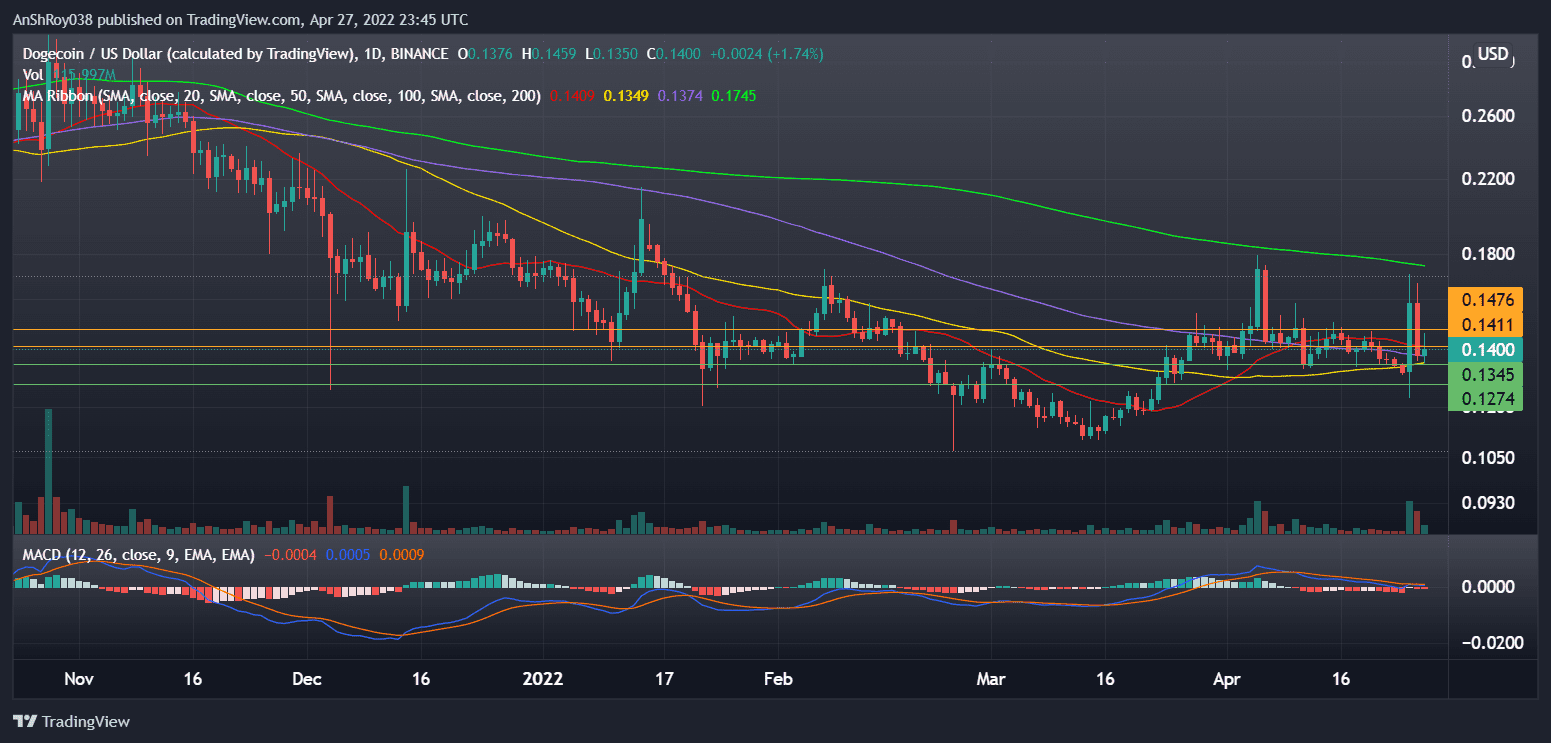
The momentum oscillator continues to forecast a bearish outlook for DOGE prices. Negative bars on the MACD histogram are expanding, indicating that the MACD line (difference of 12-day and 26-day EMA) is moving further away from the MACD signal line (9-day EMA of MACD).
DOGE prices could fall to immediate support near its 50-day MA (yellow wave) near $0.134. A market-wide sell-off could see DOGE prices fall to support near $0.127.

… [Trackback]
[…] Find More Information here on that Topic: coinchapter.com/cryptocurrency-prices-today-bal-snx-near-grt-perp-doge/ […]
… [Trackback]
[…] Read More Information here on that Topic: coinchapter.com/cryptocurrency-prices-today-bal-snx-near-grt-perp-doge/ […]
… [Trackback]
[…] Find More to that Topic: coinchapter.com/cryptocurrency-prices-today-bal-snx-near-grt-perp-doge/ […]
… [Trackback]
[…] Read More on that Topic: coinchapter.com/cryptocurrency-prices-today-bal-snx-near-grt-perp-doge/ […]