Bitcoin (BTC) is building strength from all sides — technical breakouts, rising global liquidity, and deepening market fundamentals. As resistance levels approach and upside targets align, the top cryptocurrency could be gearing up for its next major move. Let’s discuss further.
Falling Wedge Breakout Signals Further Bitcoin Gains
Bitcoin formed a falling wedge pattern on the weekly chart during the past few months. A falling wedge is a bullish chart formation that typically signals a strong breakout when the price closes above the resistance trendline. In this case, Bitcoin already broke out of the wedge and rallied about 14% since the breakout point.
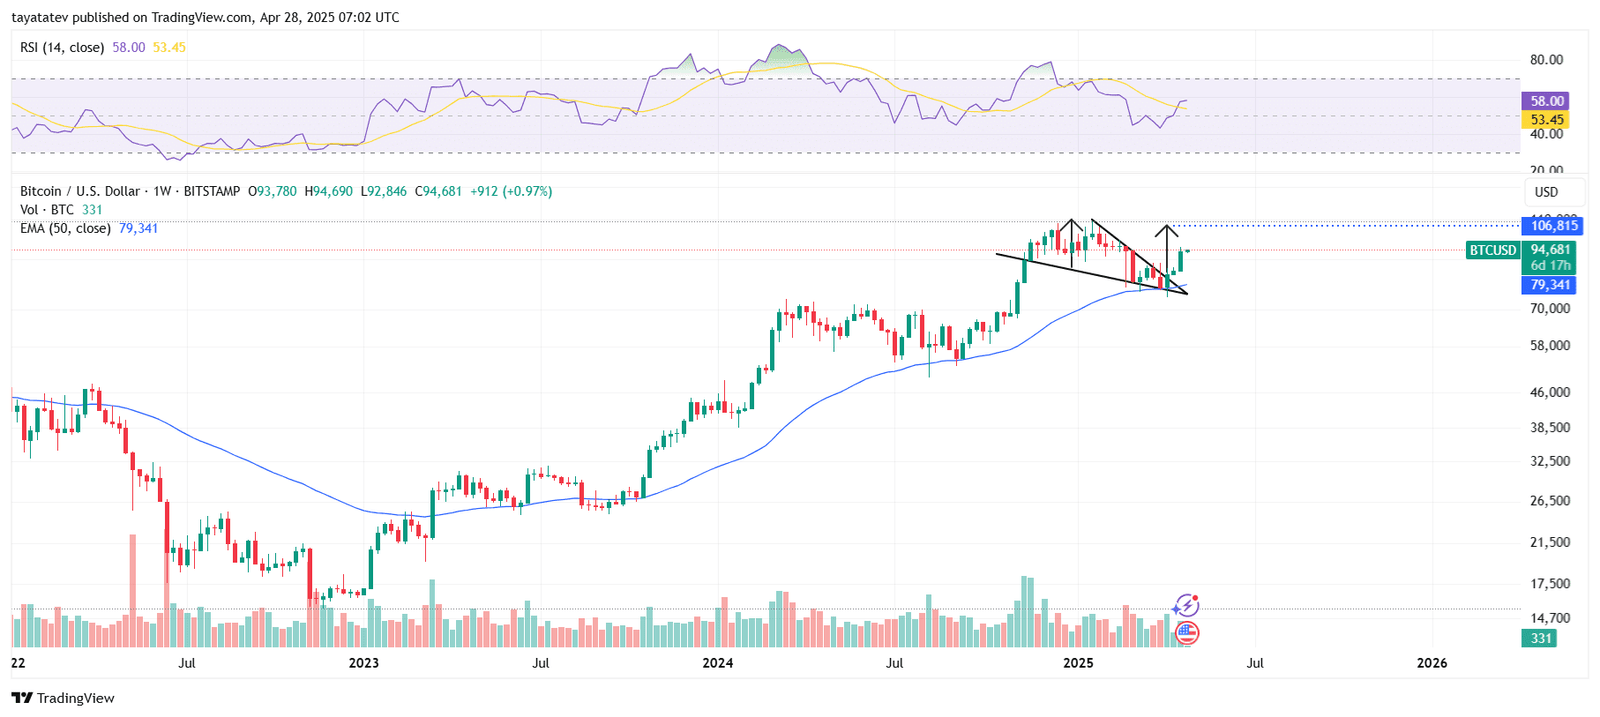
If the bullish momentum continues, Bitcoin could climb another 14% from the breakout level, setting a target price near $106,815. The breakout aligns well with typical wedge dynamics, where the full measured move usually mirrors the widest part of the wedge.
Moreover, the 50-week Exponential Moving Average (EMA) at $79,341 is trending higher, reinforcing the long-term bullish outlook. The Relative Strength Index (RSI) also provides an important signal: after dipping near the neutral 50 zone, it has reversed upward and now stands at 58, indicating growing bullish pressure without reaching overbought conditions yet.
Trading volume on the breakout week increased compared to previous weeks, adding further confirmation that the breakout is genuine and not a false move. If volume remains strong in coming sessions, Bitcoin could maintain its upside trajectory and meet the wedge target soon.
Global Liquidity Surge Backs Bitcoin’s Push Toward $150K
At the same time, the Global M2 Liquidity Index at the bottom of the chart gives strong confirmation. The Global M2 supply, which shows how much money is available in the world’s economies, has reached a new all-time high (ATH). Usually, when M2 liquidity rises, Bitcoin’s price also goes up. As more money enters the markets, Bitcoin often benefits by attracting some of that money.
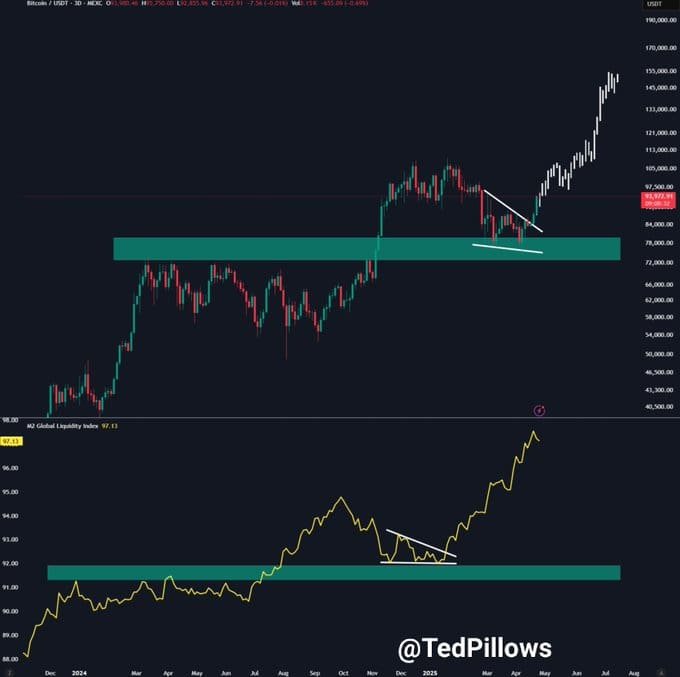
In this chart, M2 liquidity had a short pause in late 2024 but then broke out together with Bitcoin’s price, showing extra strength in the rally. Earlier confusion about India’s M2 numbers turned out to be a mistake caused by a data glitch, so the Global M2 numbers shown here are correct.
Looking ahead, Bitcoin looks ready to keep moving toward $150,000. The growing M2 liquidity alone gives a strong reason for Bitcoin to rise even higher. Even if M2 stays at its current level, Bitcoin’s history shows that it usually follows liquidity growth. So, Bitcoin has strong support both from its price patterns and from the increase in money flowing through global markets.
Bitcoin’s Bullish Fundamentals Build Strong Case for Above $100,000 Target
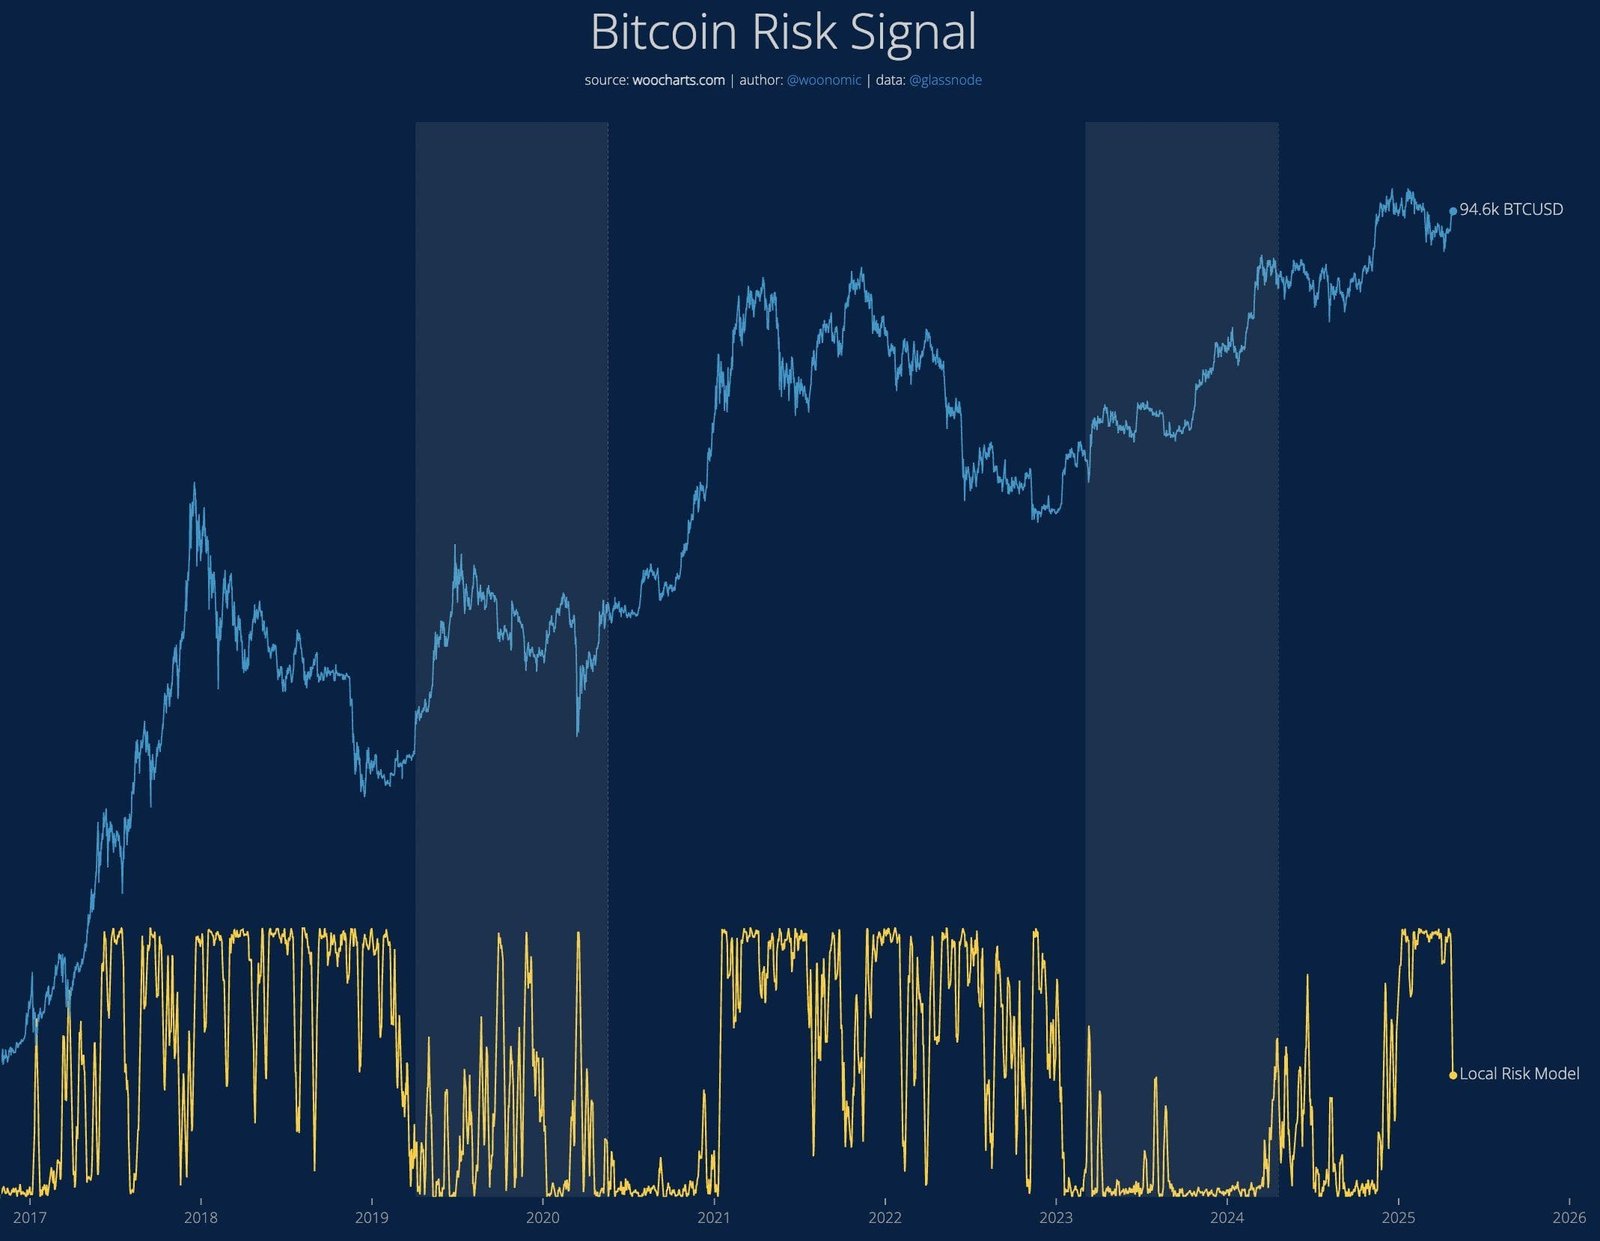
Meanwhile, Bitcoin’s fundamentals continue to show strength, with on-chain analyst Willy Woo stating that Bitcoin could reclaim its all-time highs if capital inflows stay strong. Woo explained in a detailed X thread that investors should view price dips as healthy corrections, not signs of a market collapse.
He pointed to rising capital entering the Bitcoin network, with both total and speculative flows bottoming out recently. According to Woo, this movement creates a bullish environment.
“BTC fundamentals have turned bullish, not a bad setup to break all-time highs,”
Woo said.
Additionally, Woo highlighted Bitcoin’s deepening liquidity, as shown by his risk model trending downward. When liquidity increases, future price drops usually become less severe, helping avoid large sell-offs. Woo emphasized,
“All dips are for buying under the present regime. In the very short term, there’s good chances of dips.”
Bitcoin already reclaimed medium-term targets at $90,000 and $93,000. A new interim target around $103,000 has formed, and Woo expects Bitcoin to reach this level before pushing toward the $100,000 milestone. He underlined that these targets rely on sustained capital inflows, not short-term speculation.
Bitcoin Shows Strength as Decoupling and Holder Accumulation Deepen
However, Woo also cautioned that short-term risks remain. Bitcoin’s on-chain Volume-Weighted Average Price (VWAP) currently sits +3 standard deviations above the mean, which signals that Bitcoin is overextended compared to its typical trading range.
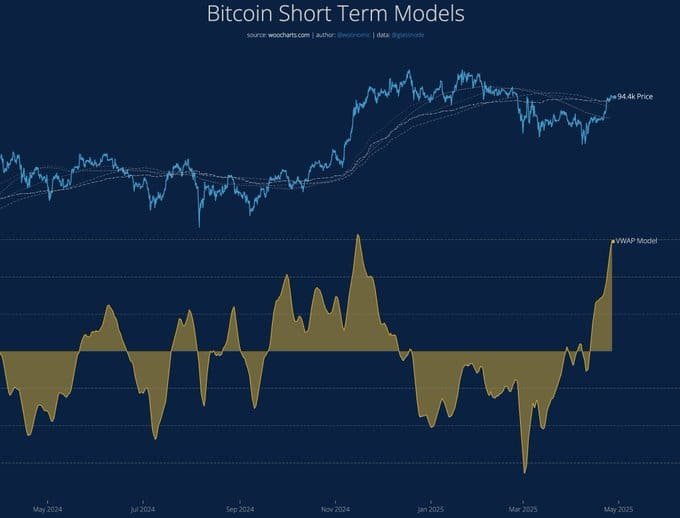
“It’ll be hard to move upwards with decent momentum due to overextension,”
Woo warned. He added that sideways movement or a slow grind higher is more likely in the immediate term rather than a sharp rally.
Meanwhile, broader market signals continue to support Bitcoin’s recovery. Bitcoin has reestablished its negative correlation with the U.S. Dollar Index (DXY) and has also decoupled from the NASDAQ, as shown by a sharp drop in their correlation from 0.91 in January 2025 to 0.83 in April, according to CryptoQuant data.
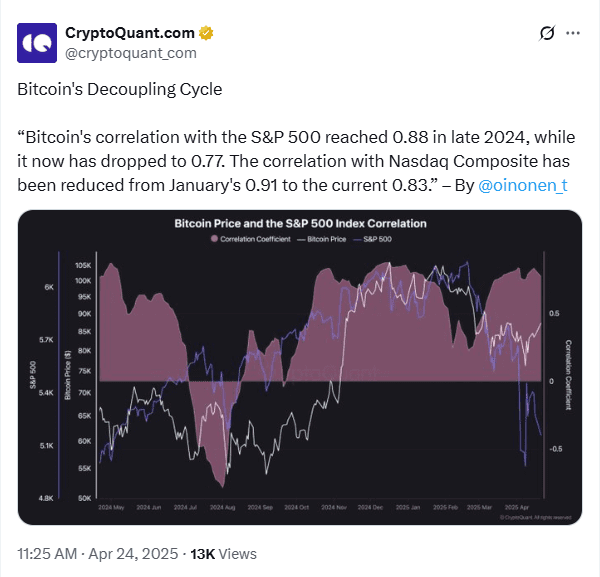
This weakening link between Bitcoin and major stock indices suggests that Bitcoin is starting to behave more independently from traditional markets. As a result, Bitcoin’s price movements are becoming driven more by its liquidity dynamics and investor flows rather than by general stock market trends.
At the same time, long-term holders are accumulating more Bitcoin, strengthening overall market confidence.
