
Key Solana Takeaways:
- DeFi protocol Solana‘s native token SOL flashed a Double Top pattern.
- The price-volume Divergence also hinted at an upcoming bearish sentiment.
YEREVAN (CoinChapter.com) – Smart contract platform Solana’s native token SOL soared 35% since Oct 20 and briefly reached $218 in the European session Monday, registering a new all-time high. The price action settled at $212 in the New York session and retested a resistance line that could reverse the uptrend. Additionally, the digital asset hinted at several bearish technical indicators.
Double Top for SOL?
SOL flashed the signs of a bearish pattern dubbed ‘Double Top.’ The reversal pattern forms after an asset peaks at a certain level twice, with a moderate setback in between. If the digital asset follows the pattern, Solana traders should watch out for the low between the two highs ($123.9, a 42% downtrend from the current value).
Should the digital asset reach the mentioned level, it could confirm the pattern and drop lower. Additionally, SOL flashed another bearish indicator, a Price-Volume Diversion.
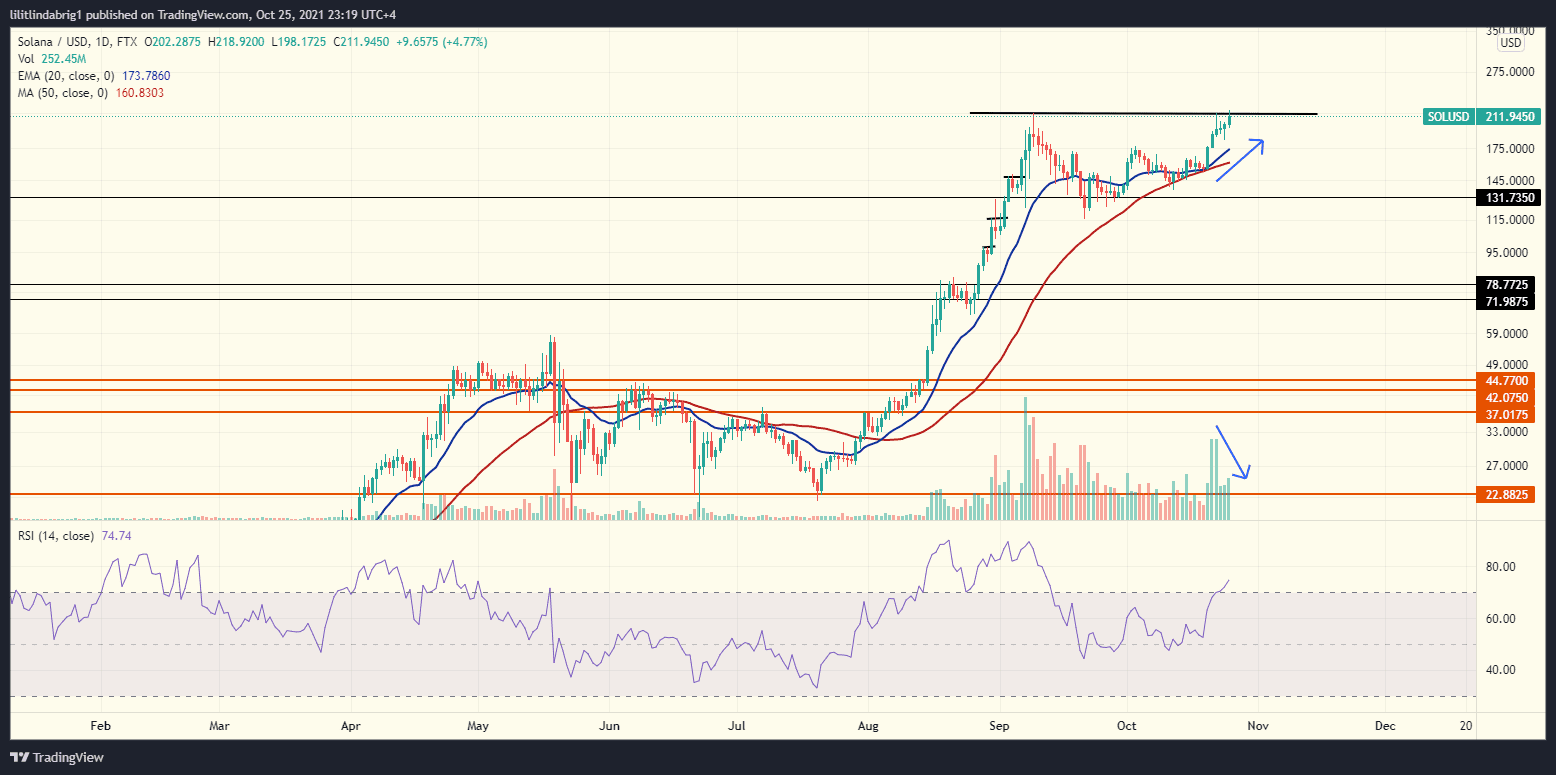
In detail, a Divergence occurs when a technical indicator does not follow the direction of the price action. For example, on the chart above, the trading volume (vertical bars at the bottom of the chart) are declining, while the price is bullish. Thus, the price-volume Divergence is a bearish signal.
Also read: Solana soars 21% to six-week high amid altcoin boom; SOL eyes $275 next.
Other bearish factors
In addition, the ‘overbought’ relative strength index (RSI) also supported Solana bears.
RSI is a momentum indicator and reflects the traders’ confidence level towards an asset. When the graph charts between 50 and 70, the RSI favors the bulls. However, if it gets above 70 (75 in the New York session), traders might consider the asset ‘overbought’ and choose to secure their profits by pulling their bets, subsequently reducing the price.
During the previous rally (July 29 – Sep 9), Solana’s token charted over 70 for a month, before a consolidation phase. Thus, an overbought RSI alone wouldn’t hint at an upcoming decline.
Also read: Bitcoin analyst predicts $250K BTC price top by January 2022
Conclusions based on the Divergence alone could also lack reliability. However, the bearish Divergence combined with the Double Top pattern and an overbought RSI is substantial enough to signal a weakening of the bullish trend. The upcoming sessions will show if the bulls receive bearish Solana news.

… [Trackback]
[…] Here you can find 85208 additional Information on that Topic: coinchapter.com/solana-risks-double-top-crash-as-sol-shows-bearish-price-volume-divergence/ […]
… [Trackback]
[…] Here you can find 68651 more Information to that Topic: coinchapter.com/solana-risks-double-top-crash-as-sol-shows-bearish-price-volume-divergence/ […]
… [Trackback]
[…] Find More Info here to that Topic: coinchapter.com/solana-risks-double-top-crash-as-sol-shows-bearish-price-volume-divergence/ […]
… [Trackback]
[…] Read More here to that Topic: coinchapter.com/solana-risks-double-top-crash-as-sol-shows-bearish-price-volume-divergence/ […]