
Key Bitcoin Takeaways
- Bitcoin prices could move up north if the MACD indicator prints a bullish cross on the daily chart.
- BTC/USD pair could decline if MACD flashes bearish cross on the weekly chart.
- RSI points to oversold conditions, but a close above $60,000 is necessary to reignite bullish sentiment.
JAIPUR (CoinChapter.com) – Bitcoin prices could explode to the upside or decline down based on how the moving average convergence divergence (MACD) indicator behaves on daily and weekly BTC charts.
A bullish MACD cross on the daily BTC/USD chart would indicate an upside price action. On the other hand, MACD flashing a bearish cross on weekly charts would imply a drawdown. The MACD problem showed up as the benchmark cryptocurrency persisted below $60,000 for almost two weeks.
Related: Bitcoin drops alongside global markets on worries over new COVID-19 strainMoreover, a global selloff of risk-on assets triggered by Omnicron variant fears further strengthened bearish sentiment.
MACD 101
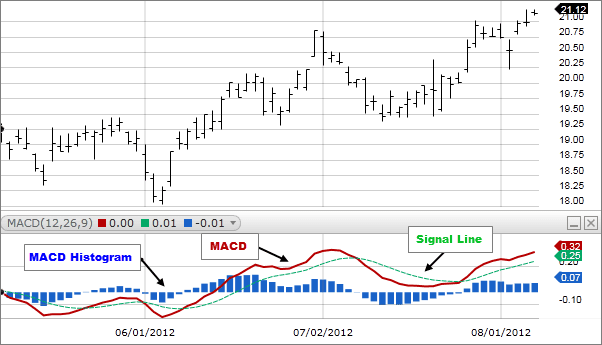
In technical analysis, the MACD indicator is primarily a momentum indicator. It follows the trend and shows the relationship between two moving averages (MA) of an asset’s price. Daytraders/investors extensively use MACD to spot direction changes in prices. Based on the same, they form decisions regarding entering, adding to, or exiting their existing positions.
MACD crossovers greatly help make sense of markets. Wrongly playing them could lead to traders incurring significant losses. However, participants leveraging crossovers judicially end up booking decent profits.
If the MACD crosses above the “signal line” (as shown below), it is a signal to go long on an asset. But traders must qualify it as a bullish confirmation only if the positive crossover occurs after a brief correction. Conversely, the reverse is true when the MACD indicator prints a move below the signal line.
Bitcoin And MACD Crossovers
TradingShot is mostly bullish Bitcoin. However, the TradingView-based cryptocurrency analyst and trader opined that the MACD indicator greatly influenced BTC/USD price movements on daily and weekly charts. And that explains the dip which followed after the recent price uptick.
Related: Michael Saylor's MicroStrategy bought the Bitcoin dip at a discount.Bitcoin’s MACD looked to form a bullish crossover on the daily chart, which TradingShot said is reminiscent of the trend reversal post-September.
“On 1D, it would be a huge bullish development if the MACD makes the Bullish Cross that is close to form. Last time a MACD Bullish Cross took place below the 0.00 line on the 1D time-frame, was on September 30, exactly when the October rally started.”
remarked TradingShot in the latest Bitcoin market analysis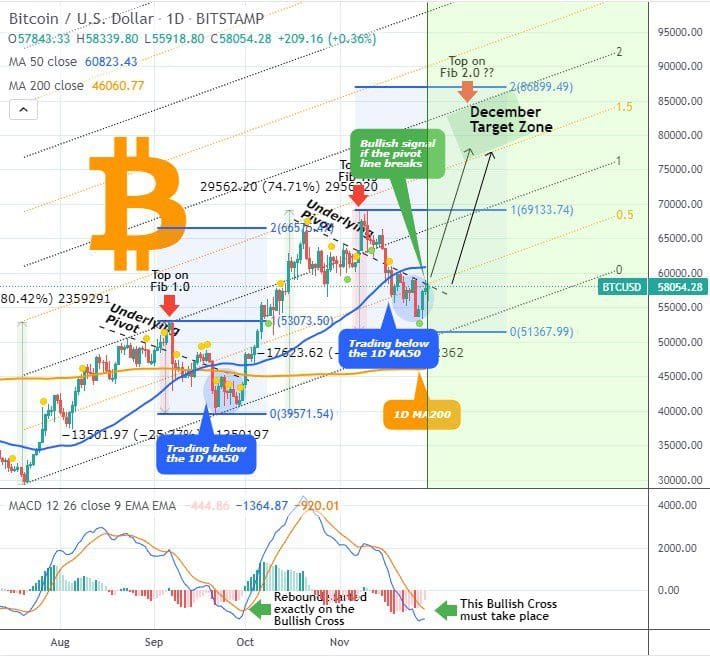
Bearish MACD Crossover May Play Spoilsport
But all uptrend hopes may fade for Bitcoin if the MACD prints a bearish cross on the weekly chart. TradingShot explicitly mentioned that the benchmark digital currency “SHOULD AVOID THE BEARISH CROSS” lest a market downturn similar to the May crash earlier this year could occur.
Despite the bearish possibility, a September 2020 Bitcoin market fractal could prove to be the silver lining. Negative MACD crosses didn’t have a pronounced effect on BTC/USD markets then. The same could repeat and save the day in the event of a bearish MACD crossover.
“However even if the Bearish Cross takes place, a fractal from September 2020 may save the day, as long as it stays flat. As you see on the chart, even though at the time the MACD lines crossed each other, they stayed flat as BTC traded on the Pivot line from the previous High above the 1D MA50 (blue trend-line) for a whole month before the aggressive 5 month parabolic rally started.
BTC/USD Technical Setup
The BTC/USD pair rose 5% in the intraday session on Tuesday. The pair resumed its uptrend since Saturday. The oversold relative strength index (RSI) wave supported the flagship crypto asset’s rally. As mentioned earlier, MACD looks to print a bullish crossover on the daily chart. If that happens, BTC will post higher gains.
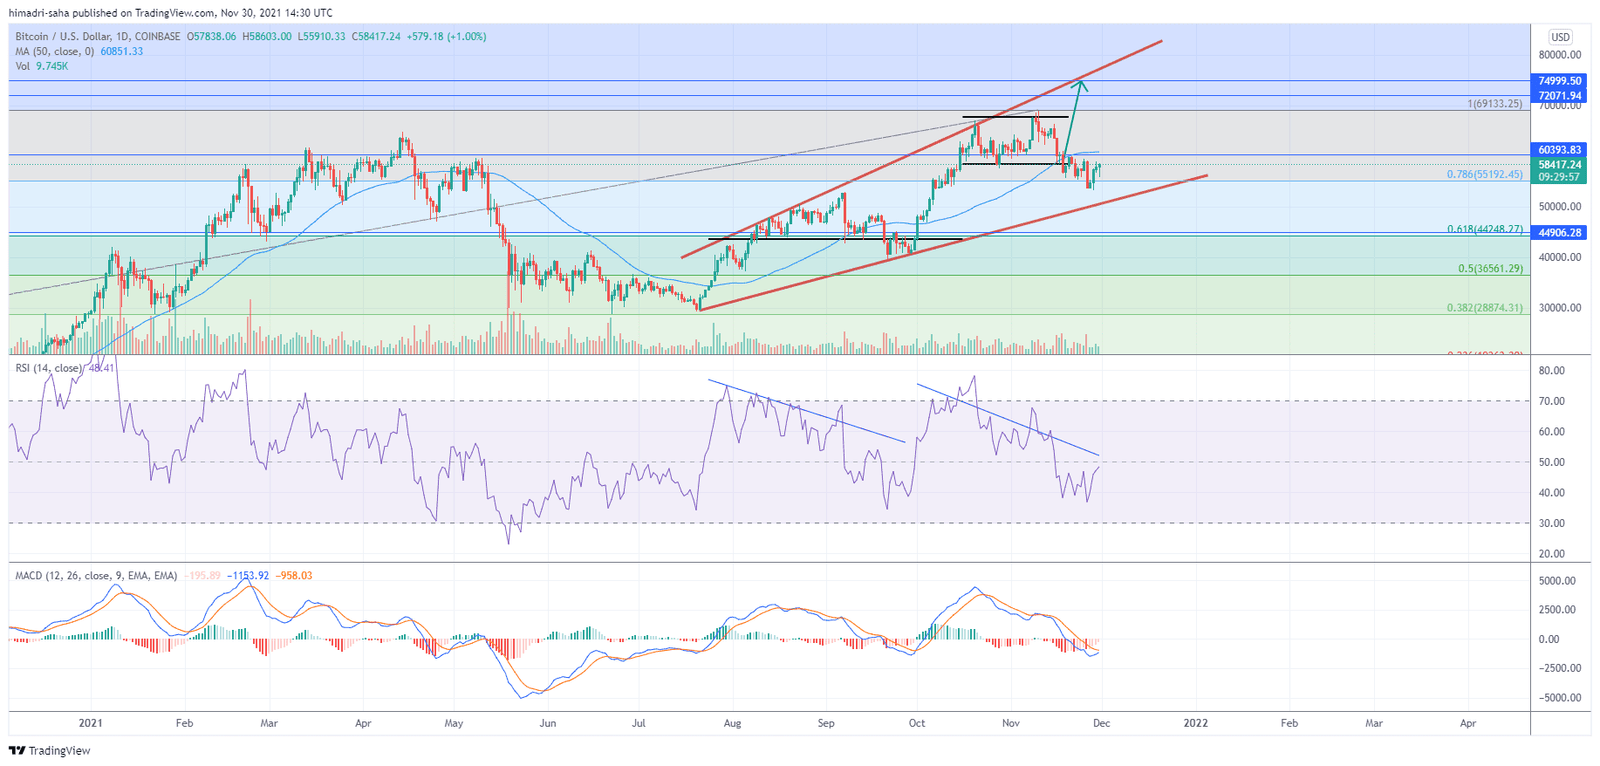
Buyers need to reclaim and close above the $60,000 resistance for Bitcoin to rally further up. The current market scenario resembles the pre-October rally phase.

I’m really inspired together with your writing talents as smartly as with the layout on your blog. Is this a paid theme or did you customize it your self? Either way stay up the nice quality writing, it is uncommon to look a nice weblog like this one these days!
… [Trackback]
[…] Information on that Topic: coinchapter.com/bitcoin-momentum-dependant-macd-cross-btc-charts/ […]
… [Trackback]
[…] Info on that Topic: coinchapter.com/bitcoin-momentum-dependant-macd-cross-btc-charts/ […]
… [Trackback]
[…] Info on that Topic: coinchapter.com/bitcoin-momentum-dependant-macd-cross-btc-charts/ […]