
Bitcoin (BTC) price surged to a new all-time high near $109,500 this week, fueled by ETF inflows, improving regulatory sentiment, and renewed institutional demand. The move marked a sharp 3% daily gain, pushing year-to-date returns above 16%. While momentum remains strong, profit-booking traders could spike the bearish pressure against the token.
Ethereum lagged, trading near $2,480 at last check—well below the key $3,000 threshold and down nearly 27% YTD. The sharp divergence in BTC and ETH price action underlines Bitcoin’s continued dominance in this cycle, especially as ETF-driven capital flows remain concentrated in BTC spot products.
Market-wide sentiment has improved considerably. Bitcoin’s realized price, currently around $93,200, now sits below its spot value, reinforcing the return of profitability among holders and transitioning away from capitulation zones. Altcoins posted mixed results, with rotation still limited to select narratives.
One of those narratives is memecoins. These speculative assets rallied aggressively on news of Bitcoin’s record high. Dogecoin (DOGE) gained over 6% in 24 hours. Solana-based WIF, TRUMP coin, and FART token posted double-digit jumps as traders re-entered high-risk plays amid bullish tailwinds. Bitcoin’s breakout has reawakened the crypto market, even if capital flows remain uneven across sectors.
BTC Bulls Defend Breakout Amid Heavy Profit-Taking
Bitcoin’s breakout to a new all-time high near $109,870 triggered immediate profit-taking, but bulls continue to defend the breakout zone aggressively. Bitcoin price dropped below $107,000, highlighting the strong bearish presence near the level.
Following a strong close above $107,000, the immediate resistance is near $113,450. The price level marks a key decision zone. Bitcoin price has attempted to pierce this zone multiple times over the past three sessions but has failed to close above it. The lack of follow-through above this resistance hints at seller presence, likely from early ETF entrants and profit-booking whales.
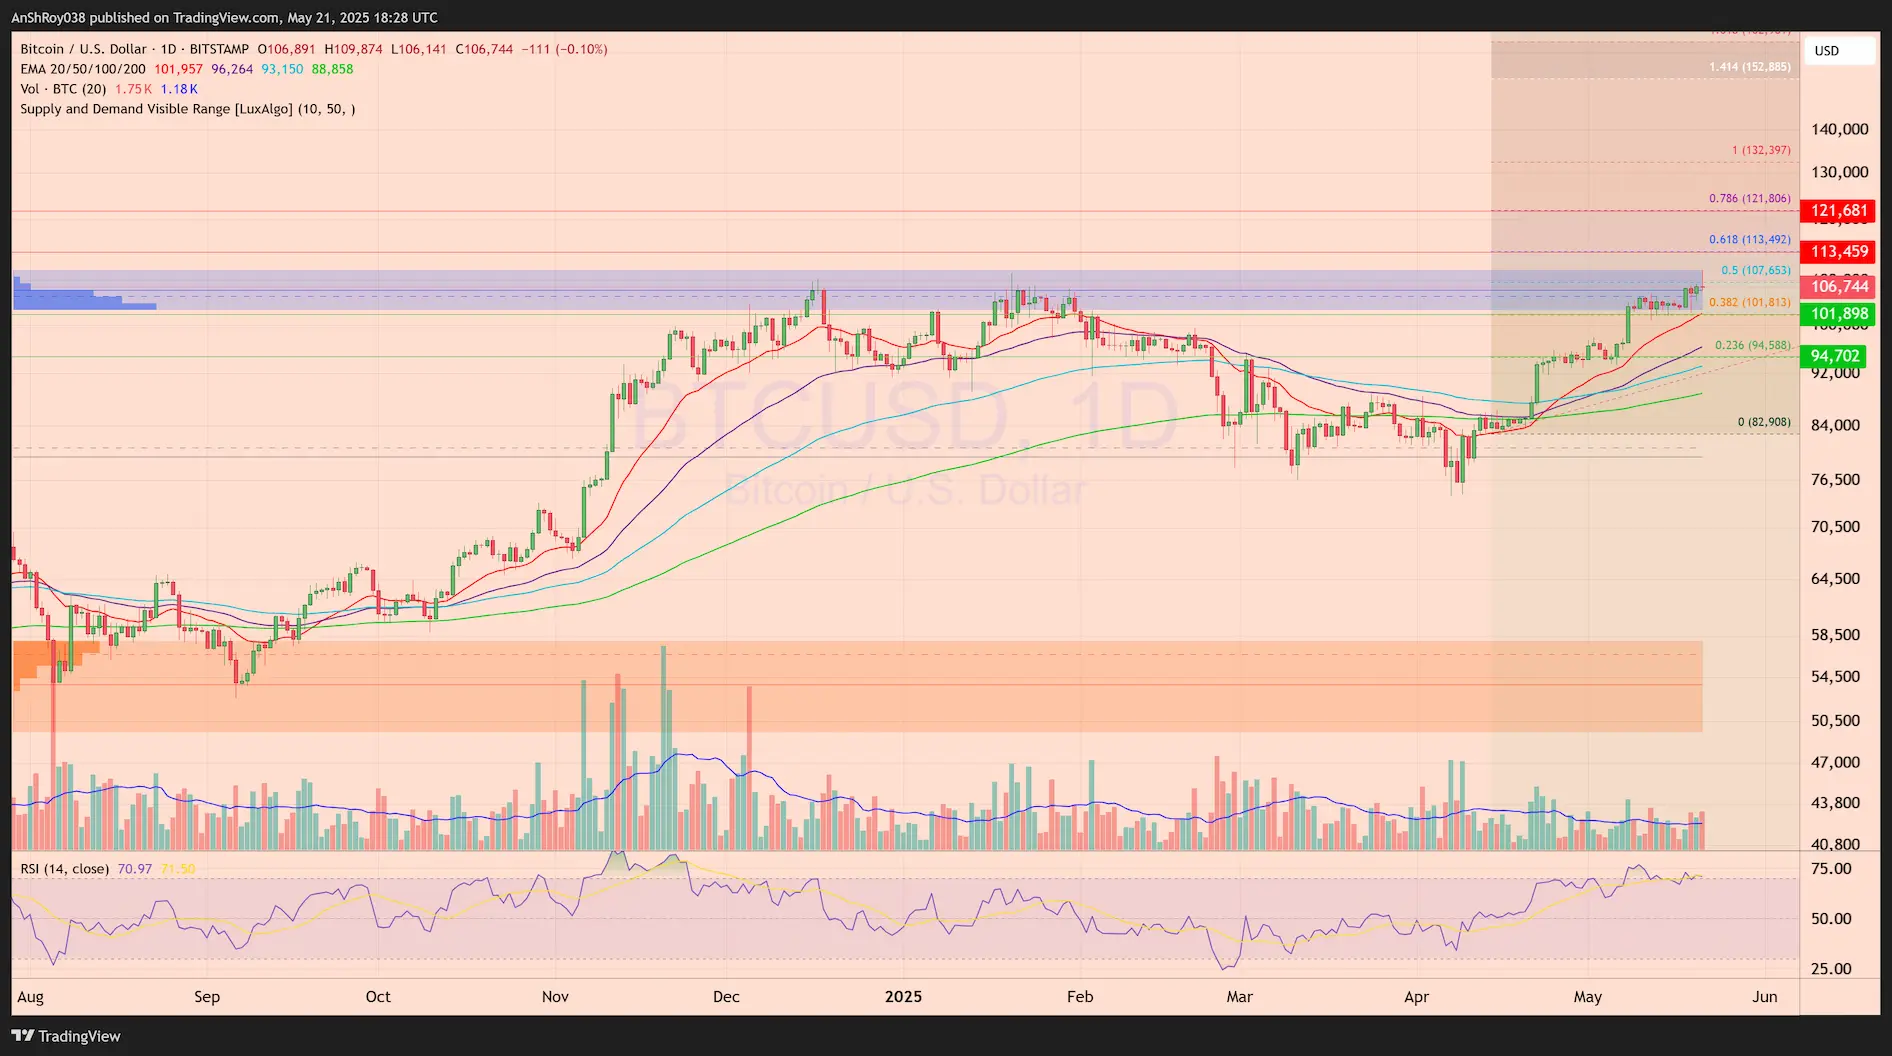
Volume data shows elevated activity during the breakout and subsequent pullbacks, confirming the breakout strength and the distribution pressure. While this volume does not yet indicate capitulation, it does suggest a possible local top forming unless bulls can reclaim and hold above $113,459. Flipping it would give BTC price a chance to target the resistance near $121,700, close to the 0.786 Fib level.
On the downside, the $101,900 level remains the next strong support. It acted as resistance during the early May push and has since flipped into a critical zone of interest. A close below this mark could trigger a deeper retracement, targeting the $94,700 support, also aligned with the 0.236 retracement.
The daily RSI remains in overbought territory, hovering near 72. This level typically signals exhaustion, especially when paired with stalled momentum near resistance.
Unless bulls manage to close above $107,000, the current setup may evolve into a broader consolidation. For now, the market stands at a key inflection point between trend continuation and local correction.
On-Chain Data Signals Maturity as Institutional Capital Narrows Focus
Bitcoin’s new all-time high near $109,500 coincides with one of the most significant on-chain shifts in its history—its Realized Cap is now closing in on the $1 trillion mark. According to Glassnode, it took just two years to move from $1 million to $1 billion in Realized Cap between 2011 and 2013, but nearly six years to climb from $100 billion to $1 trillion.
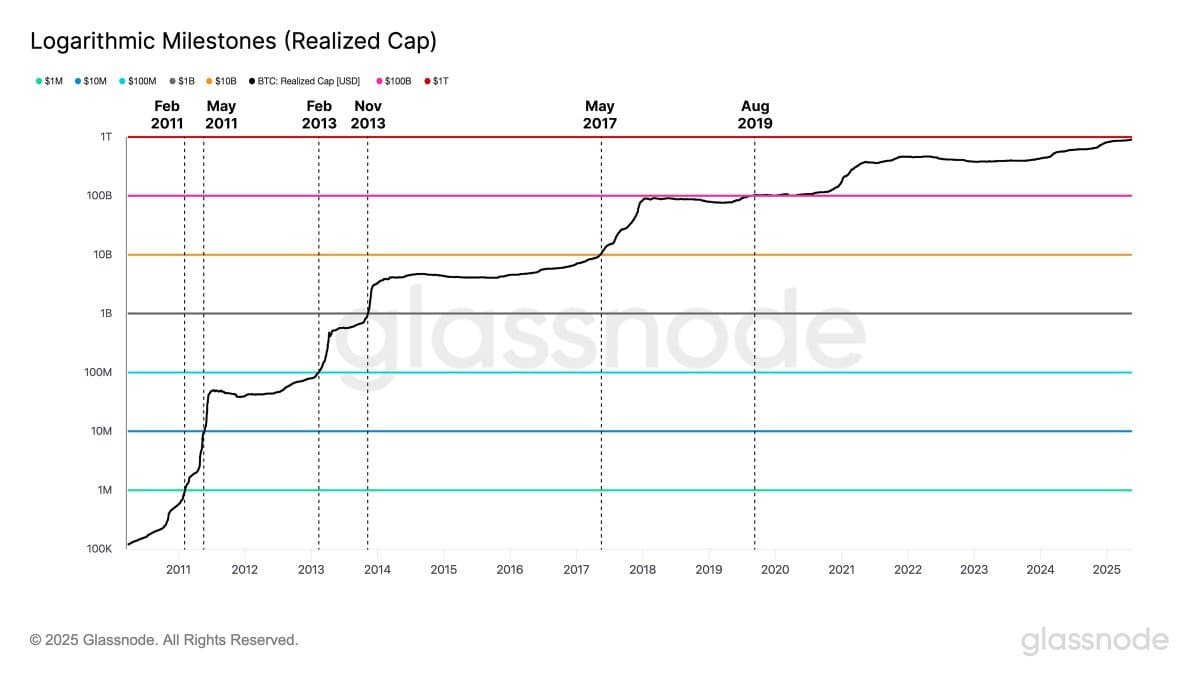
The deceleration reflects Bitcoin’s evolution from a speculative asset into a capital-heavy, institutionally anchored network.
The MVRV ratio—used to assess unrealized profit—has risen sharply since the $74,000 local low. Glassnode shared in an X post that aggregate MVRV has climbed from 1.74 to 2.33, while short-term holders flipped from a -18% loss (0.82) to a +13% gain (1.13). Long-term holders also saw their MVRV rise from 2.91 to 3.30. The rise in unrealized profit has boosted investor confidence while limiting sell pressure, reinforcing the sustainability of Bitcoin’s uptrend.
Yet, the capital fueling this move is more selective than previous cycles. CoinShares data shows that digital asset fund inflows declined for the third consecutive week, but Bitcoin retained the lion’s share. This divergence confirms that institutional capital isn’t leaving—it’s concentrating. BTC remains the only asset consistently attracting fresh inflows, while altcoins lose favor in the face of uncertain macro conditions.
Taken together, the data paints a picture of a maturing asset. Bitcoin’s rise is no longer driven by hype cycles or shallow retail demand, but by foundational growth, built on patient capital, real conviction, and long-term holder dominance.
