

Key Takeaways:
- Bitcoin prices are moving in a technical pattern called BARR.
- The pattern indicates BTC might have an upside target near its ATH.
NEW DELHI (CoinChapter.com) — Bitcoin’s current bearish price action might be part of the Bump and Run Reversal (BARR) pattern, asserts a tweet by crypto trader Phoenix.
In detail, BARR is a reversal pattern that forms after excessive speculation drives an asset’s price too fast. The pattern has three phases, Lead-in, bump, and run. A gradual slope that forms when prices rise or fall creates the lead-in phase. Then, there is a gradual change in prices during the lead-in phase.
Next comes the bump, identifiable by a steep increase/decrease in the current trend direction. The bump’s demand line deviates away from the lead-in line. After speculation dies down, price action begins to cap. Prices then start moving towards the original lead-in line.
Also Read: Bitcoin holds above $50K as greenback rises against global currencies.Finally, the run phase begins when prices move above the lead-in line resistance. Prices may initially hesitate before breaking through; however, if an uptrend starts, the price target is usually the highest point of the pattern.
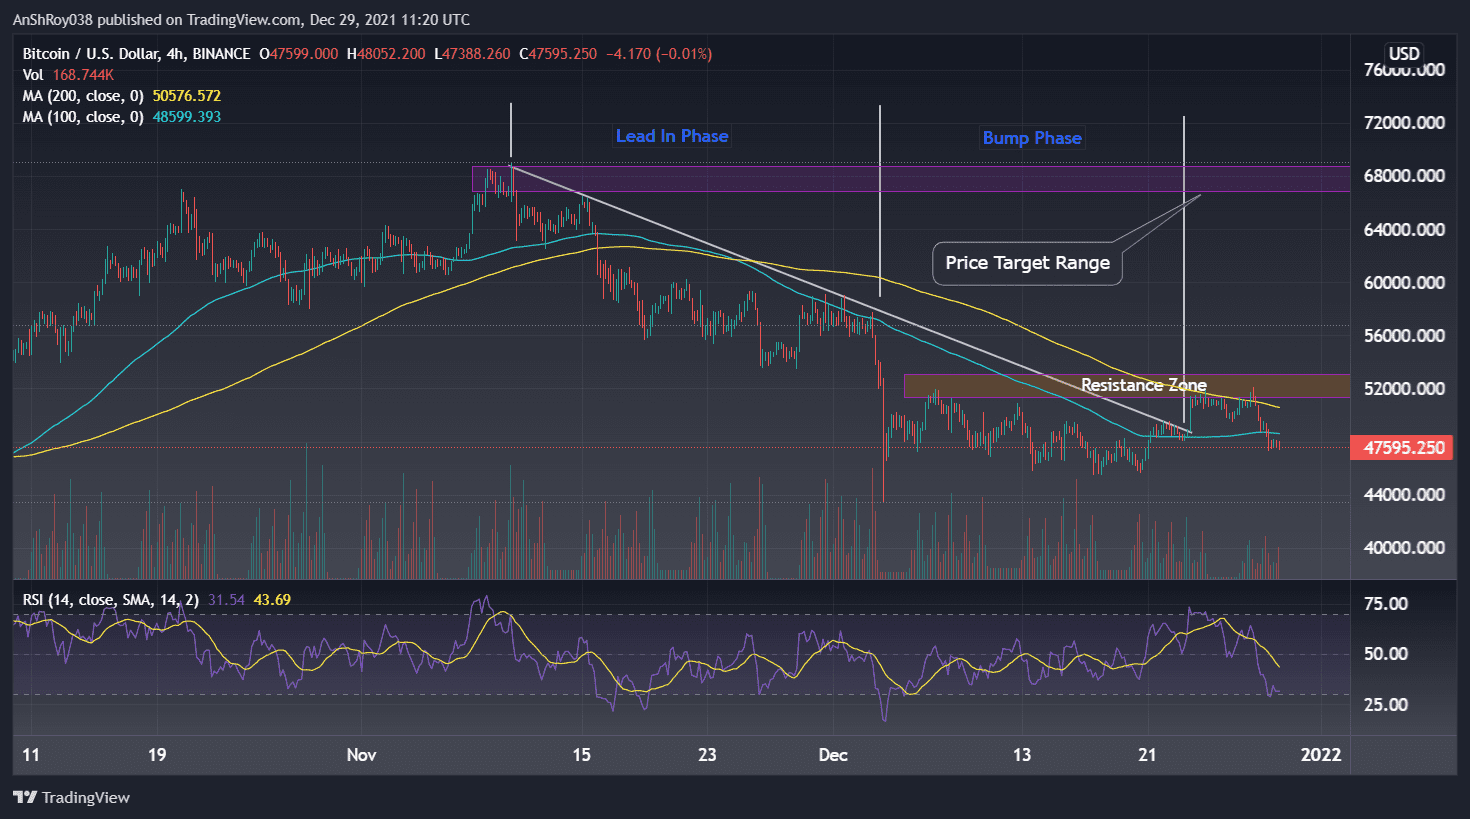
For BTC, the price target zone is near its ATH, which means Bitcoin could retest its ATH before the rally ends. But, first, Bitcoin needs to move out of the resistance zone near the $50,000 price level. Once prices break and consolidate above immediate resistance, BTC could then start an uptrend to challenge its previous ATH.
Bitcoin Price Charts
Bitcoin prices fell 6% on Dec 28, losing over $3,000 to reach $47,600, strengthening the bears’ grip on the world’s largest cryptocurrency. Although BTC prices tried recovering on Wednesday, the price action seems too weak to support an uptrend.
Currently, Bitcoin price faces resistance near the $49,400 price level, with BTC’s 26-day EMA providing resistance near $50,900. Furthermore, on Wednesday, Bitcoin’s 50-day and 100-day MA lines formed a death cross. A death cross forms when a token’s short-term MA line moves below its long-term moving average trendline.
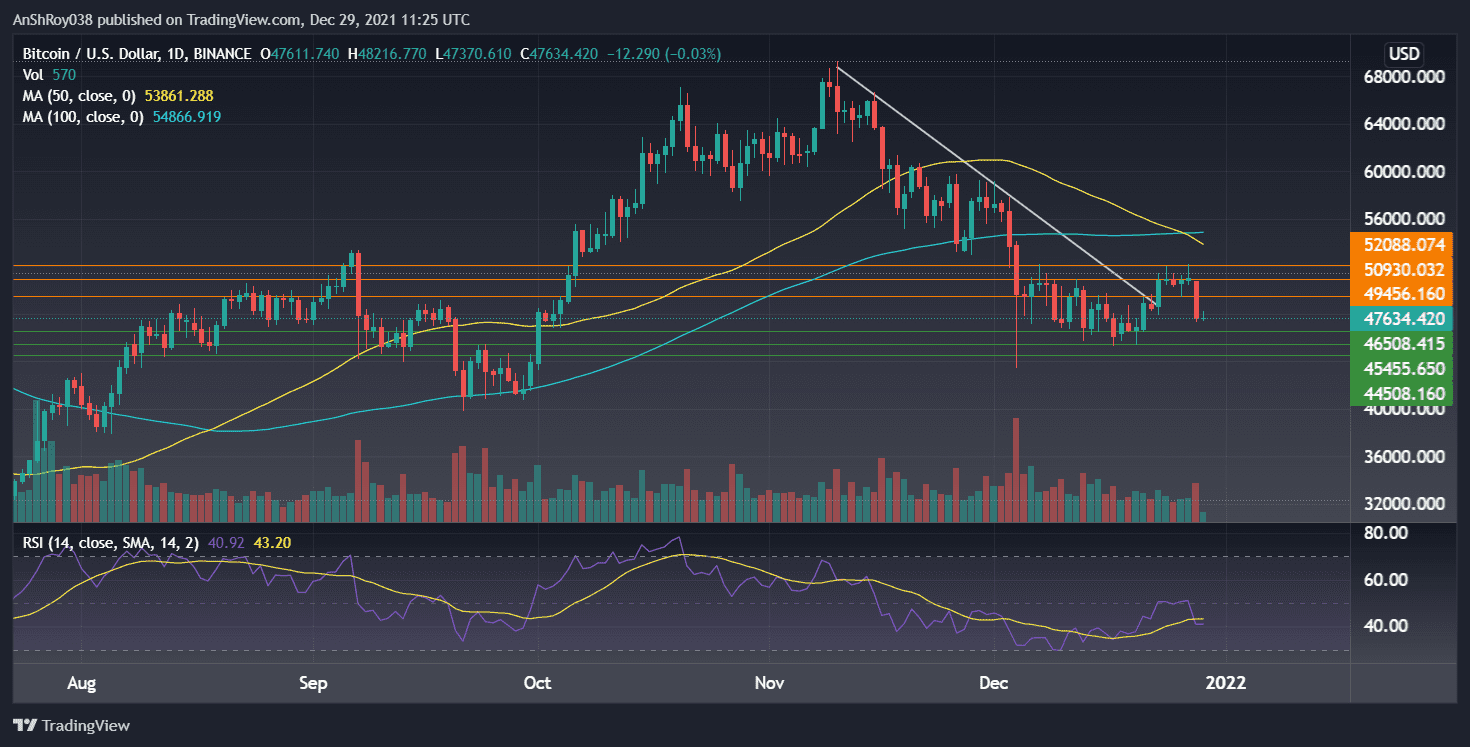
A death cross often indicates the potential for a major sell-off, and Bitcoin’s resulting price action was textbook. However, BTC’s price has support near $46,508. A continued sell-off could see prices pushed to $45,455. Additionally, Bitcoin’s Tuesday crash made BTC bearish across all time horizons.
As prices dipped, the relative strength index followed suit, with the RSI trendline dropping sharply. Currently, the RSI for Bitcoin is neutral, clocking 40.92 on the daily charts.
Also Read: Bitcoin disappearing from El Salvadorian wallets, but BTC finds $51k levels again.Meanwhile, the trend-based momentum oscillator MACD forecasts a weakening bullish momentum for Bitcoin prices. Bars on the MACD histogram are contracting, indicating that the MACD line (difference between 12-day and 26-day EMA) is moving down towards its signal line (9-day EMA of MACD).
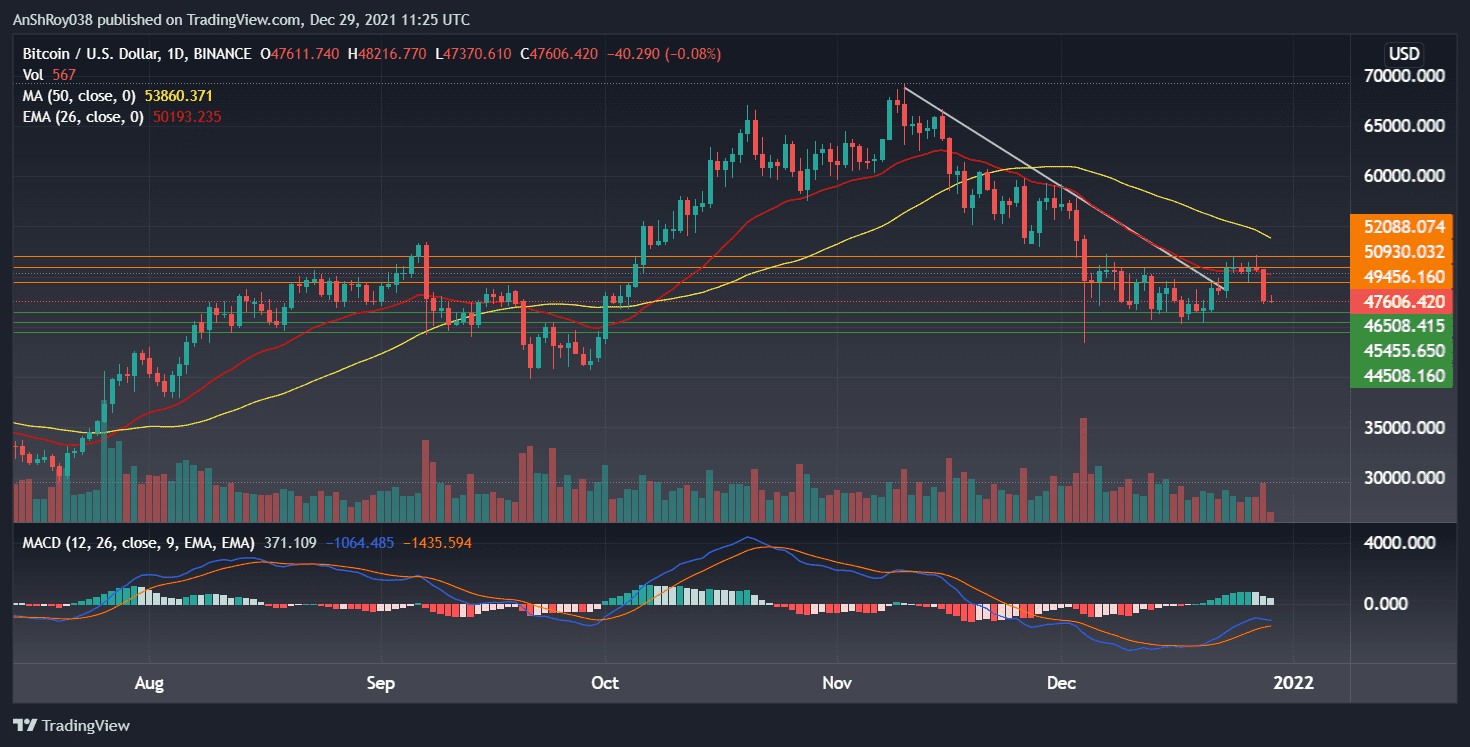
Contracting MACD bars indicate a lack of bullish momentum for the prime cryptocurrency, which is currently down by nearly 18% since the start of this month. Dec 28’s dip caused the Bitcoin market cap to shrink by 5% to reach $886 billion.
At the time of writing, BTC was changing hands at $46,904, down 1.55% on the day.

… [Trackback]
[…] Read More here on that Topic: coinchapter.com/bitcoin-recent-slump-part-of-a-bullish-reversal-pattern-lets-analyze/ […]
… [Trackback]
[…] Find More to that Topic: coinchapter.com/bitcoin-recent-slump-part-of-a-bullish-reversal-pattern-lets-analyze/ […]
… [Trackback]
[…] Read More to that Topic: coinchapter.com/bitcoin-recent-slump-part-of-a-bullish-reversal-pattern-lets-analyze/ […]
… [Trackback]
[…] There you can find 97602 more Info to that Topic: coinchapter.com/bitcoin-recent-slump-part-of-a-bullish-reversal-pattern-lets-analyze/ […]