
Key Bitcoin takeaways:
- Bitcoin recovers from below $42,000 to near $50,000.
- The retracement comes ahead of a key inflation data release in the U.S.
- Technicals support a $100,000 BTC outlook.
NEW DELHI (CoinChapter.com) — The Bitcoin (BTC) price finished lower last week, signaling that investors were unwinding their riskier bets amid a global stock market selloff led by the so-called Omicron variant FUD.
The world’s leading cryptocurrency by market capitalization plunged more than 20% on Saturday to slip below $42,000, just two weeks after rallying to its new all-time high at $69,000. While its price recovered Sunday, they fell short of reclaiming $50,000 as resistance, a sentiment that rippled into the first day of the new weekly session.

Another major catalyst behind Bitcoin’s massive decline last week was over-leveraged crypto derivatives. Noelle Acheson, head of market insights at cryptolender Genesis Global Trading, noted that a massive sell order might have triggered margin calls, which, in turn, might have forced traders to liquidate their bullish positions at a heavy loss.
Bitcoin’s losses also appeared against a stronger U.S. dollar, which finished higher six weeks in a row, primarily as markets assessed the Federal Reserve’s decision to unwind its $120 billion a month asset purchasing program in the wake of persistently higher inflation. That likely helped prop up investors’ appetite for the dollar for its provable safe-haven asset.
Focus this week: CPI data
As Bitcoin wobbles below $50,000, its upside case risks weakening ahead of this week’s inflation data via the U.S. consumer price index (CPI). November’s core CPI expects to come at 4.9% year-over-year, up from 4.6% in October.
While higher inflation serves as a bullish case for Bitcoin, it also threatens to tickle Fed into accelerating its tapering program, which would then follow up with rate hikes. As a result, it would be interesting to watch how Bitcoin traders react to strong consumer price data, with tweets like this making the round in favor of the cryptocurrency:
Bitcoin Technicals
Technically, Bitcoin bulls look they are in charge despite the recent price pullback, thanks to a convincing Cup and Handle pattern.
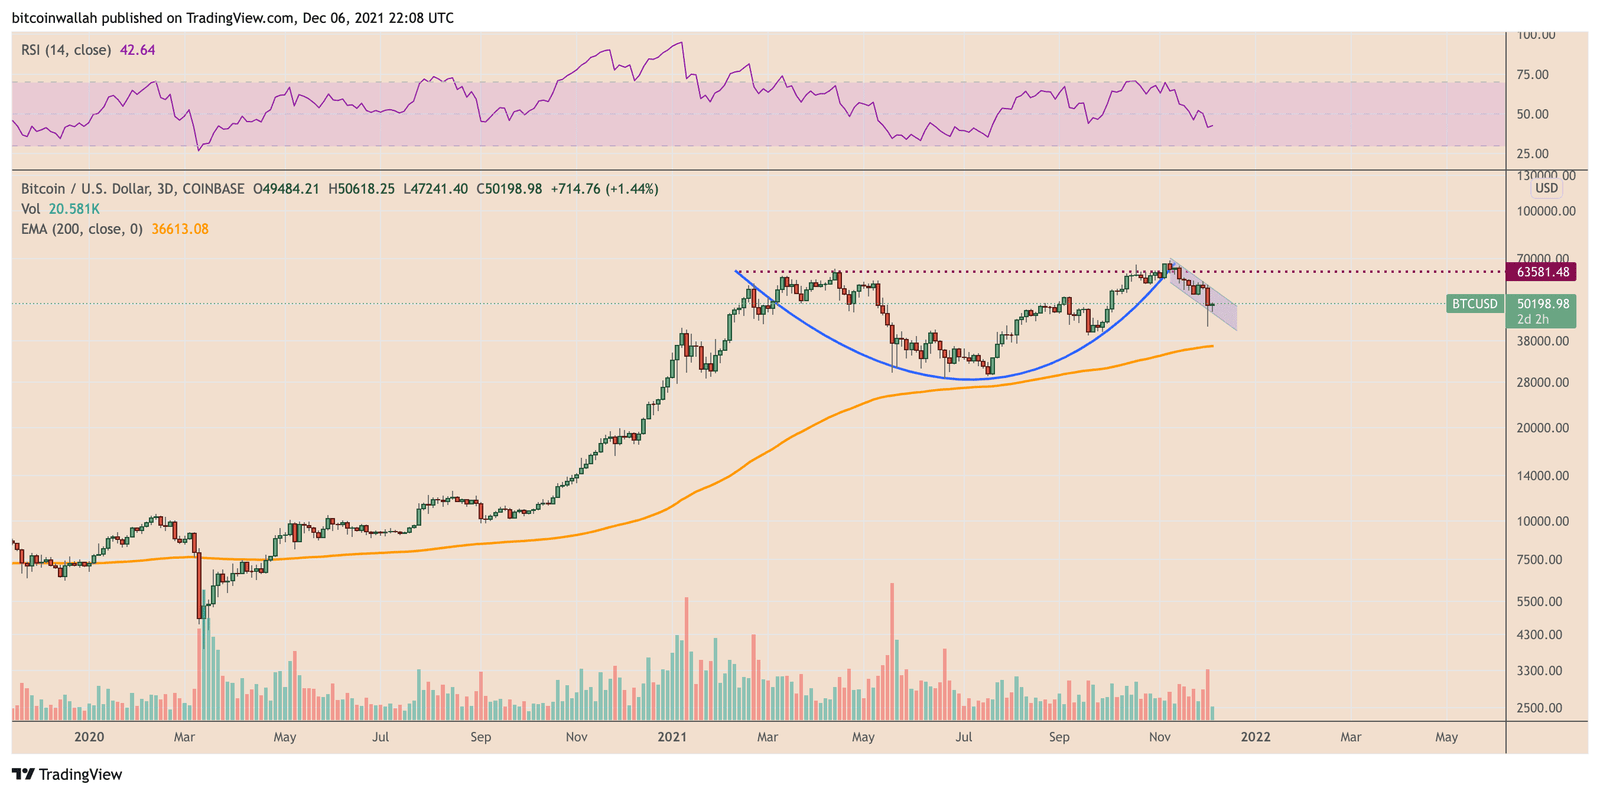
In a perfect world, the BTC price should run up towards the Cup and Handle neckline near $63,500, followed by a strong move higher equal to the maximum distance between the Cup’s bottom and the neckline. That roughly puts Bitcoin on the road to $100,000 — just not this week.

… [Trackback]
[…] Info on that Topic: coinchapter.com/bitcoin-week-ahead-ep20-btc-calm-near-50k-ahead-of-cpi-data/ […]
… [Trackback]
[…] Read More to that Topic: coinchapter.com/bitcoin-week-ahead-ep20-btc-calm-near-50k-ahead-of-cpi-data/ […]