
- Revisiting the BTT daily chart after the review on July 6.
- BitTorrent 4h chart with price action in a horizontal channel
YEREVAN (CoinChapter.com) – BitTorrent (BTT) had an indecisive week. The token didn’t fulfill the bearish or the bullish prediction and moved sideways, keeping the BTT/USD exchange rate at $0.00256 ahead of the London session Thursday. It broke out of the descending channel formation it traded in for almost three months.
Featured: BitTorrent risks 25% crash on rising wedge breakout worries.
BitTorrent 1d chart
In hindsight, the descending channel consisted of two parallel trendlines containing the BTT price. First, when the value moved to the resistance, gaining bullish momentum, traders would sell-off, afraid to bid on an overbought coin, and subsequently, sent the price down. Then, when BTT would go enough south to meet the support, traders would then go in and buy the token to save the price from plummeting.
As a result, the price moves in an overall bearish direction until BitTorrent managed to break the pattern on July 5.

Related: Financial Times wrongly equates crypto with Albania’s Ponzi scheme debacle.
The horizontal channel on the 4h chart
On July 6, it looked like BTT could fall back to the channel support line during the past review and lose an additional 43 percent.
That scenario didn’t pan out. Moreover, the bearish rising wedge formation didn’t either. BitTorrent formed a horizontal channel instead, moving sideways. As a result, the price action is much more prominent on the four-hour chart presented below. The mid-range of the track coincides with a significant support line at $0.00268.
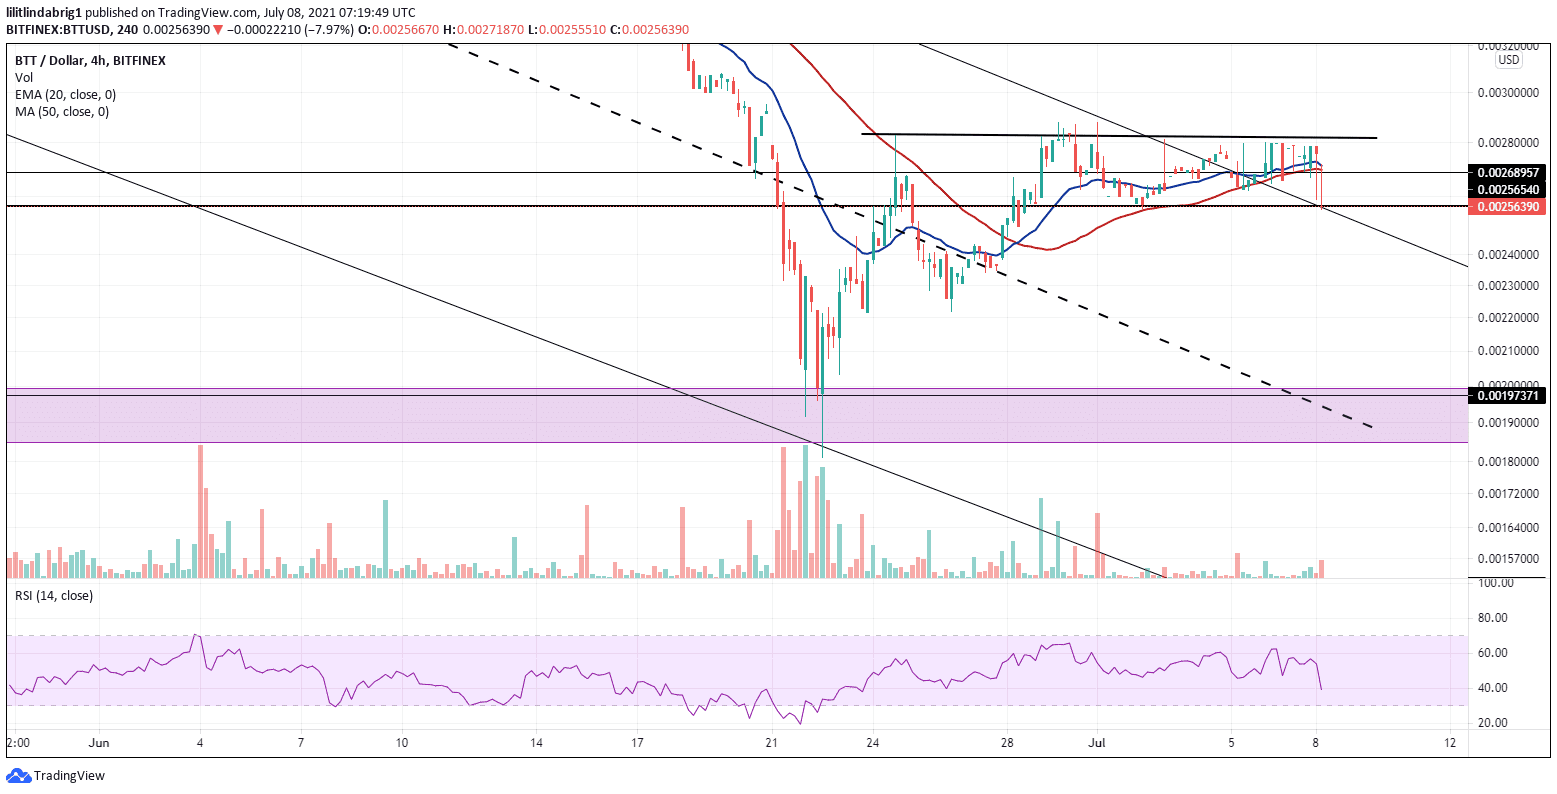
On June 28, BTT registered a golden cross when the 20-4h exponential moving average (EMA-20; blue wave) crossed above the 50-4h simple moving average (SMA-50; red wave). The recent price action threatens to reverse the golden cross, as the trajectory of the EMA-20 corrected downward.
Also read: Theta rallies 14% on patent application approval and Bloomberg feature.
As the horizontal channel doesn’t have a pronounced bias, it is hard to predict the future momentum of BTT. However, if the token can hold the channel support at $0.00256, it will likely move up to the midrange and subsequently retest the channel resistance.
BTT could eye further losses and fall back to the $0.00199 support (purple bar on the chart above).

… [Trackback]
[…] Find More Information here on that Topic: coinchapter.com/bittorrent-goes-into-conflict-mood-over-choppy-trend-whats-next-for-btt/ […]