
- BitTorrent’ bearish 4h chart against USDT
- The daily chart confirms the outlook
- What to expect?
Yerevan (CoinChapter.com) — BitTorrent (BTT), a utility token launched on the Tron blockchain in 2019, flashed bearish signs on its 4h chart in the European session Friday. After undergoing a blasting four-day upside run with a 60 percent gain on June 22-25, BTT corrected downward slightly and traded at $0.0024. But, could the correction mean more losses?
BTT’s bearish 4h chart
The bearish outlook on the 4h daily chart stemmed from the Fib Retracement fractal. The indicator is used to determine the support and the resistant levels during a price trend based on the Fibonacci sequence.
The first Fib retracement from mid-June, drawn from the sessional low of $0.0026743 to $0.0046035, saw BTT/USD spotting its most reliable support level near 61.8% Fib level as the price pulled back from its uptrend.
Similarly, the late-June Fib retracement graph, drawn from $0.0017750 swing low to $0.0026722 swing high, underwent a minor downside correction. Its drawdown saw the prices slipping below the 23.6% Fib line on Friday and was now targeting the 61.8% Fib level of $0.002121 as its primary downside target.
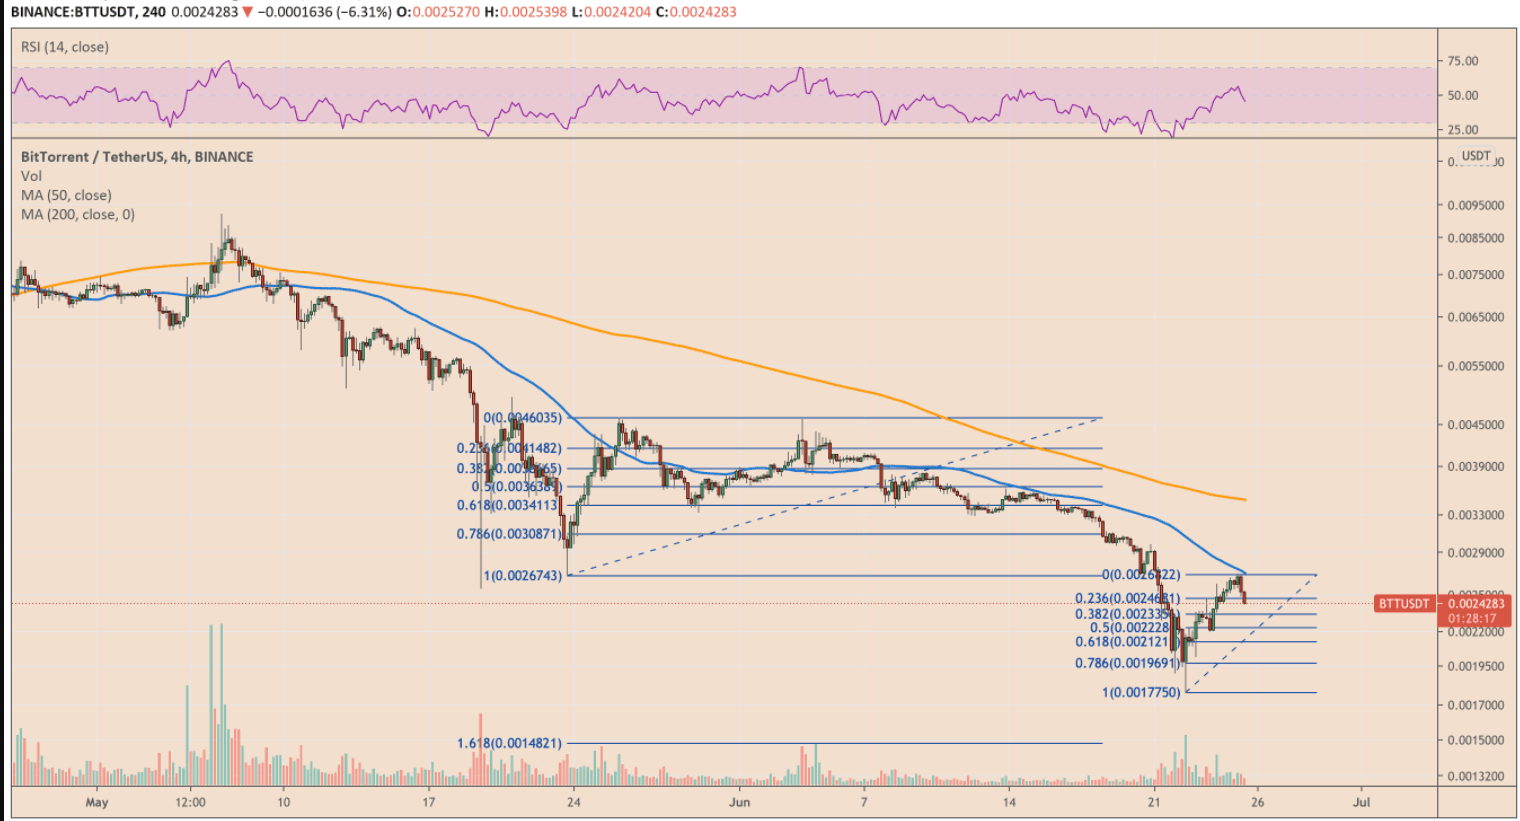
If the Fib Retracement pattern pans out, BTT could see more bearish correction ahead. The daily chart backed the overall outlook. The pullback pressure also comes from the 200-4h SMA (simple moving average) wave in blue, acting as a solid resistance.
Also read: BitTorrent burns 19% off its bid—should you buy the BTT dip?
BitTorrent daily chart
After the avalanche of declines across the charts, BTT rebounded strongly on the market-wide “buy-the-dip” sentiment, with a 60 percent advance. However, the bigger picture draws a bearish perspective ahead.
BitTorrent has been trading in a descending channel formation. The channel was instrumental in predicting the price corrections since early April. As a result, the descending channel does not bear a pronounced sentiment. However, more losses could be expected unless the utility token manages a breakout above the channel’s upper trendline.
Also read: Why this Bitcoin ETF continued accumulating BTC even amid selloffs?
Moreover, there’s a looming death cross on the daily chart between the 50-day SMA and the 200-day SMA. If the token continues to decline, the SMA-50 could adopt a trajectory with a steeper slope, reaching the SMA-200. The crossover between those two waves could please the BTT bears until the SMA-50 crosses back over the long-term SMA.

As shown on the charts above, BitTorrent could expect further bearish sentiment, despite the recent gains. Both the 1D chart and the 4h chart present a confluence of support and resistance levels for the token. As of the moment, the BTT/USD exchange rate stood at 0.00241 in the Friday session.
Also read: El Salvador to gift $30 in Bitcoin to every adult citizen

… [Trackback]
[…] Read More Information here to that Topic: coinchapter.com/bittorrents-latest-blip-comes-with-a-13-btt-crash-warning/ […]
… [Trackback]
[…] Info on that Topic: coinchapter.com/bittorrents-latest-blip-comes-with-a-13-btt-crash-warning/ […]
… [Trackback]
[…] Info to that Topic: coinchapter.com/bittorrents-latest-blip-comes-with-a-13-btt-crash-warning/ […]