
Key Takeaways:
- Bloktopia’s native token has jumped over 40% since Sunday.
- A likely reason could be Bloktopia’s upcoming Alpha update.
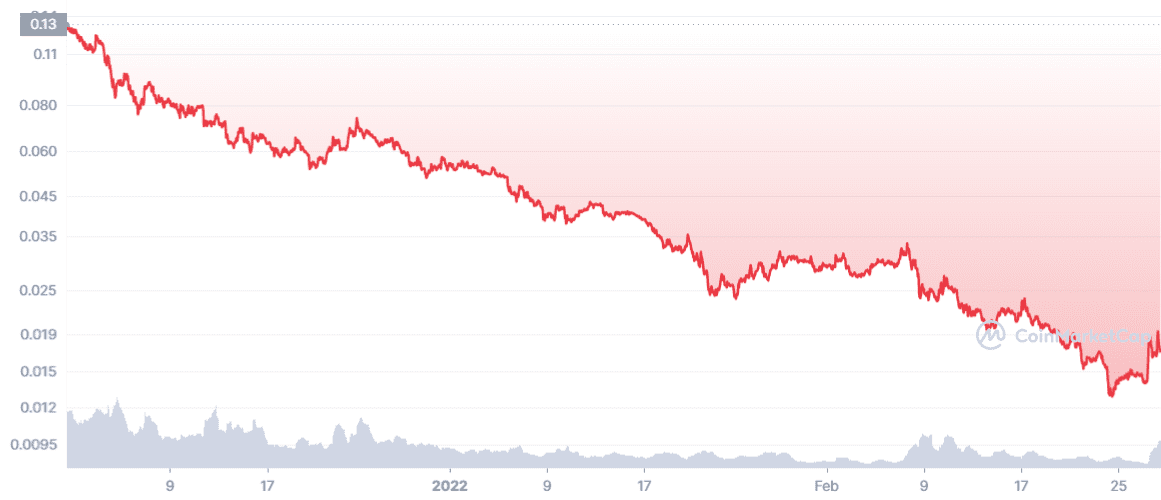
NEW DELHI (CoinChapter.com) — Bloktopia’s native token BLOK jumped 40% between Sunday’s low of $0.0139 to nearly reach $0.02 in the early hours of trading on Monday. However, prices soon pared as traders started selling to book profits.
The token has been trending downwards since December 2021 and has lost nearly 90% of its value in the past three months.
Bloktopia’s recent uptrend might be a result of its upcoming airdrop. The platform announced it would embed a play-to-earn game in the upcoming Alpha version of Bloktopia. The upgrade would help visitors win a share of 1 million BLOK tokens.
Also Read: Sotheby’s auction of 104 CryptoPunks NFTs, estimated to fetch $30M, canceled after seller withdraws.Bloktopia, a VR skyscraper with 21 floors as a homage to Bitcoin’s total supply, said the Alpha upgrade would be a preview of what’s to come later in 2022. In detail, the game would feature 12 BCubes, each of which would contain a letter that would together form a word or phrase.
The player who collects all 12 BCubes and solves the puzzle will be eligible to win a share of the prize.
Bloktopia Price Charts
BLOK prices on the 4-Hour (4-H) charts indicate bears move in to cash in on every rally. The Bloktopia token charted a golden cross on its 4-H charts, with its 26-day exponential moving average (white wave) moving above its 50-day moving average (purple wave).
In detail, the golden cross usually indicates a short-term uptrend for an asset. If an uptrend begins, BLOK will try to flip immediate resistance near $0.018 before moving on to challenge resistance near the $0.019 price level.
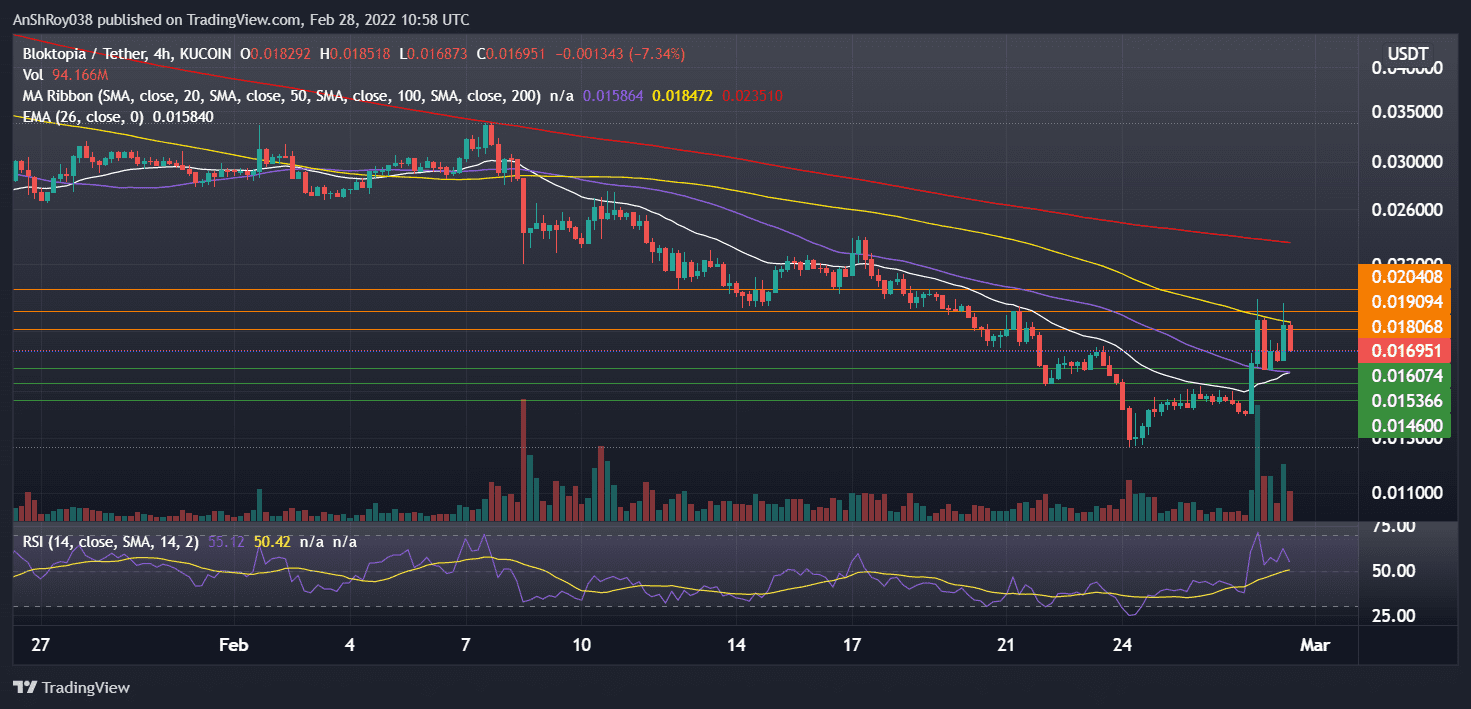
Finally, a sustained uptrend could see BLOK reaching $0.020 before prices pull back. Unfortunately, the 4-hour relative strength index for Bloktopia reached overbought levels during its uptrend on Feb 27, and the trend soon reversed.
The RSI is currently neutral, clocking 55.12 on the 4-H chart. Moreover, the RSI trendline is charting higher lows on the 4-H charts.
Also Read: Polkadot founder Gavin Wood slammed for promoting DOT amid Ukraine crisis.On the other hand, if the rally fails, BLOK would likely seek support near $0.0160, near its 50-day MA. A sustained profit booking would likely pull prices down, bringing support near $0.0154 into play. If prices breach below $0.0154 support, BLOK would likely fall to $0.0146 before recovering.
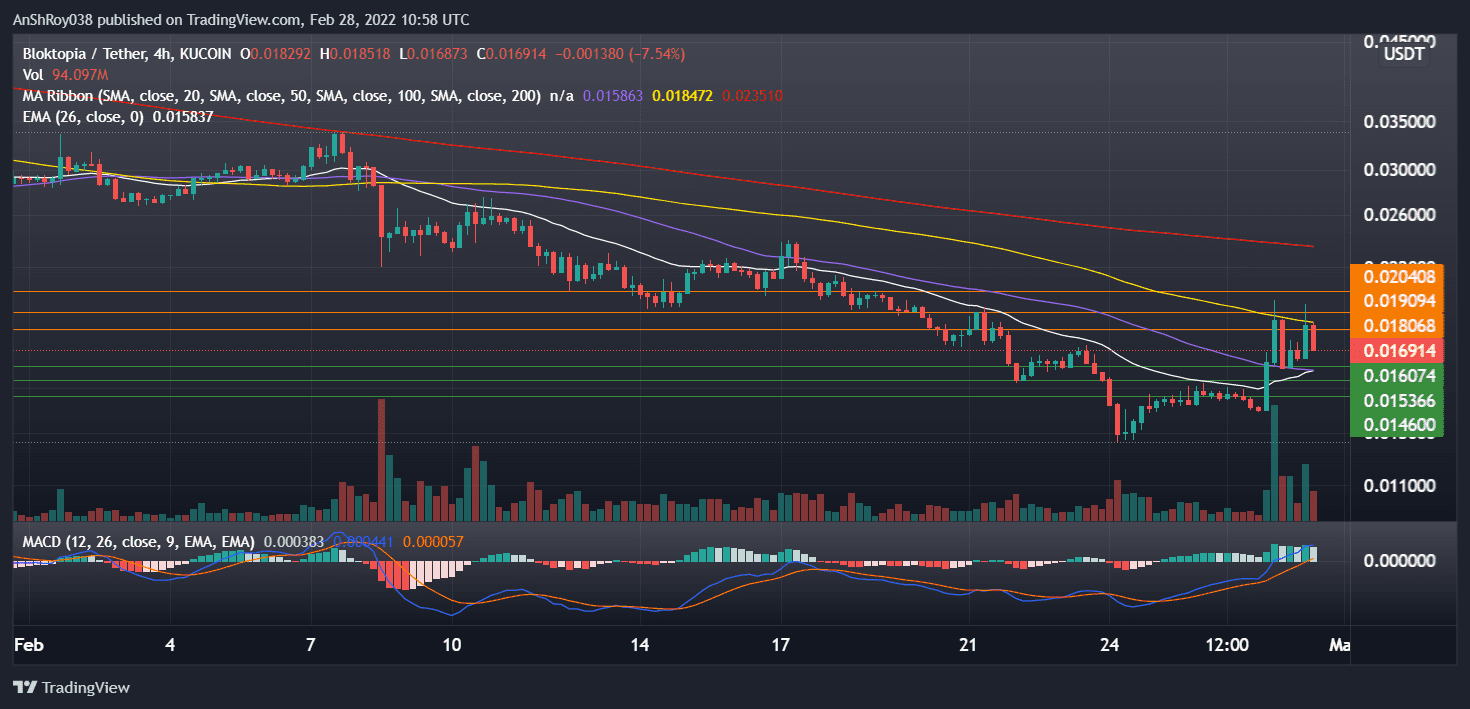
Meanwhile, trend-based momentum oscillator MACD is strongly bullish for BLOK. Bars on the MACD histogram are expanding, indicating the MACD line (difference between 12-day and 26-day EMA) is moving away from the MACD signal line (9-day EMA of MACD).
Expanding MACD bars indicate strengthening bullishness in the short-term time frame.
At the time of writing, BLOK was trading at $0.0174, up 2.88% on the day.

… [Trackback]
[…] Find More on that Topic: coinchapter.com/bloktopia-blok-token-jumps-40-in-less-than-two-days/ […]
… [Trackback]
[…] Read More Information here on that Topic: coinchapter.com/bloktopia-blok-token-jumps-40-in-less-than-two-days/ […]
… [Trackback]
[…] There you can find 56736 more Information to that Topic: coinchapter.com/bloktopia-blok-token-jumps-40-in-less-than-two-days/ […]
… [Trackback]
[…] Info to that Topic: coinchapter.com/bloktopia-blok-token-jumps-40-in-less-than-two-days/ […]