Hyperliquid (HYPE), Sui (SUI), and Bitcoin (BTC) each logged notable recoveries in the wake of the weekend’s Middle East conflict-fueled marketwide liquidation.
The recovery helped the tokens set up nearly linked reversal narratives. While Bitcoin price bounced above $106,000 briefly, helping the derivative market volatility cool down, altcoins like SUI and HYPE reclaimed key technical levels, hinting at a growing appetite for high-beta exposures.
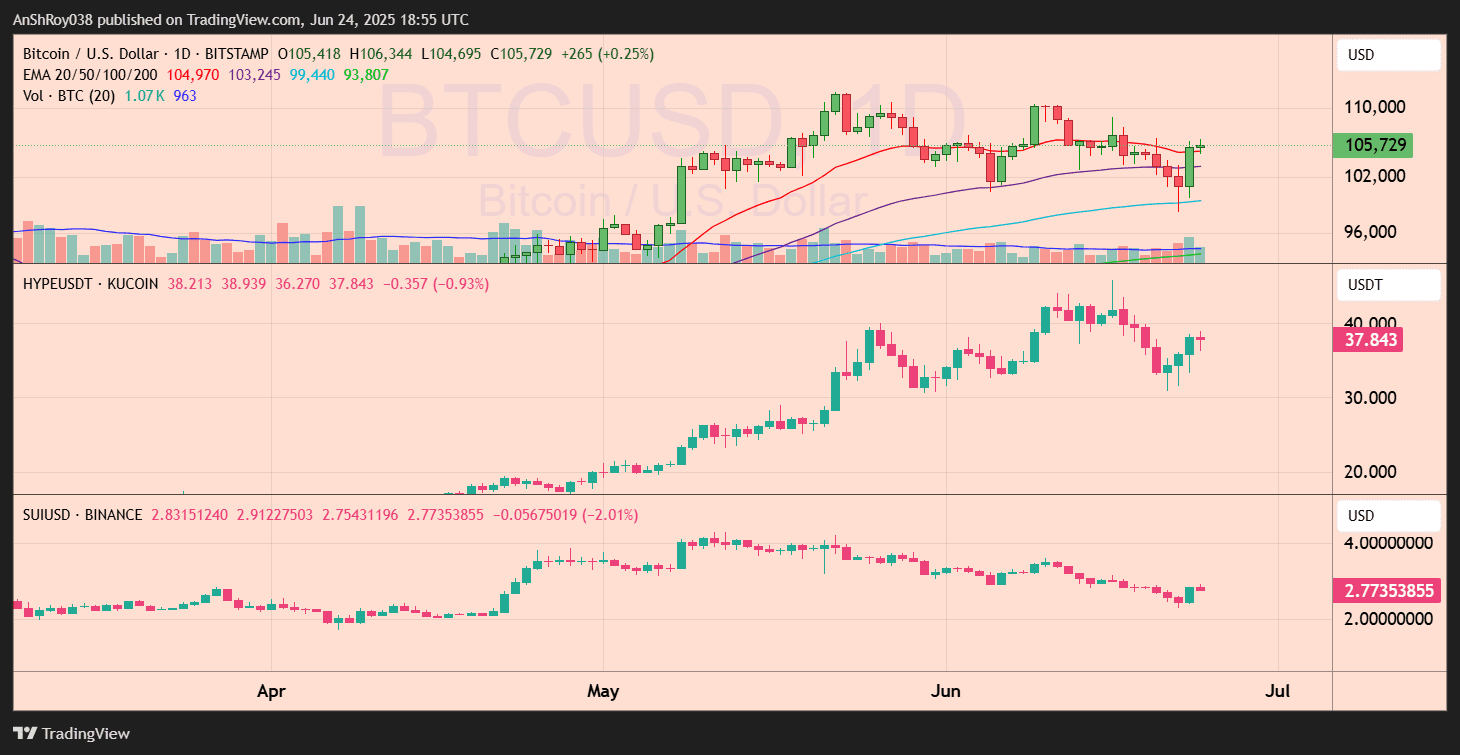
In SUI’s case, the token erased its war-driven losses with a 15% spike to $2.9 before paring some of the day’s gains on June 23, bouncing off its support zone near $2.4. However, the token fell under the control of bears on June 24. Meanwhile, HYPE price bucked the wider market trend on June 21, with the Hyperliquid token starting its rally on June 21 while the market was still falling.
HYPE price printed three straight daily green candles with surging spot volume and funding stability. Bitcoin’s structure remained rangebound but supported by ETF inflows, low long-term holder spending, and improved liquidation skew following the recent $1.2 billion long wipeout.
BTC Faces Tactical Rejection, But Underlying Accumulation Remains Firm
Despite signs of accumulation from long-term holders and institutions, Bitcoin price action remains structurally bearish on lower timeframes.

The 4-hour chart reveals a developing bullish structure, with Bitcoin forming consecutive higher lows (HL) and aiming to establish another higher high (HH).
A post by trader Crypto Patel emphasized that the structure remains technically neutral to bullish. Still, a breakout and close above $108,900 (LTF HH) and $110,654 (HTF HH) are essential to confirm full bullish continuation for the prime crypto.
Until then, Patel stated that smart money would likely short the $107,000–$109,000 zone, treating it as a key supply region.
From a technical standpoint, price must close above $110,654 to shift the high time frame structure back to bullish. Fair value gaps (FVGs) and partially filled imbalances further support the likelihood of short-term volatility and rejections.
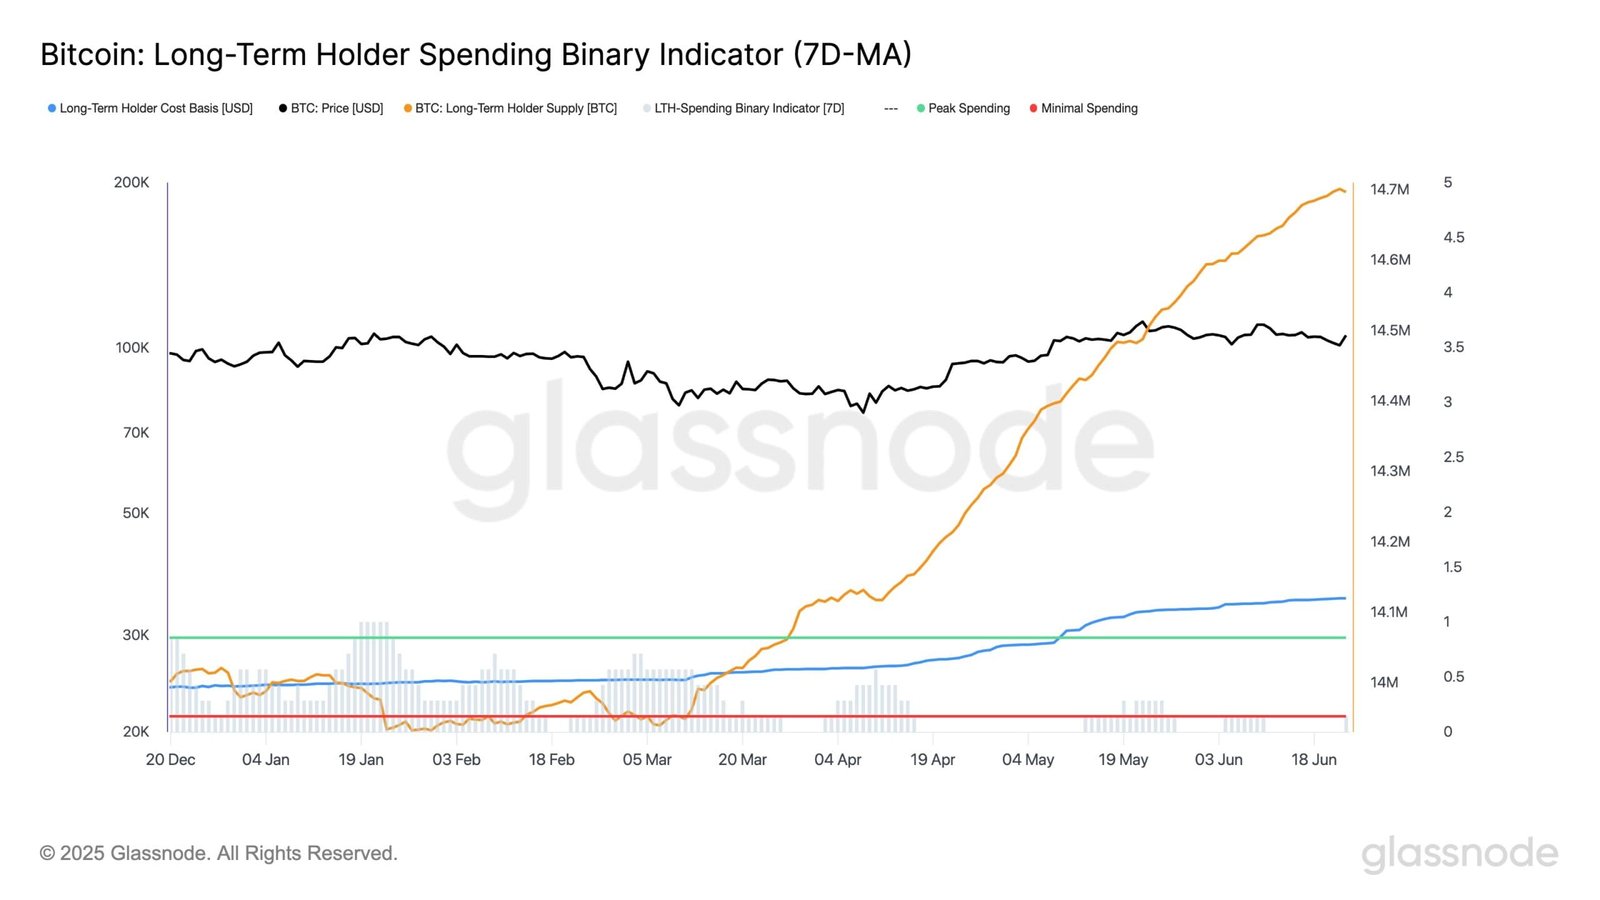
Meanwhile, Glassnode shared a post regarding the Long-Term Holder (LTH) Spending Binary Indicator, which flipped back to “minimal spending” as of June 24, marking the first such reading since June 10. Simultaneously, LTH supply remains near all-time highs (~14.7 million BTC), implying conviction among seasoned investors. These holders are not contributing to distribution, despite ongoing volatility.
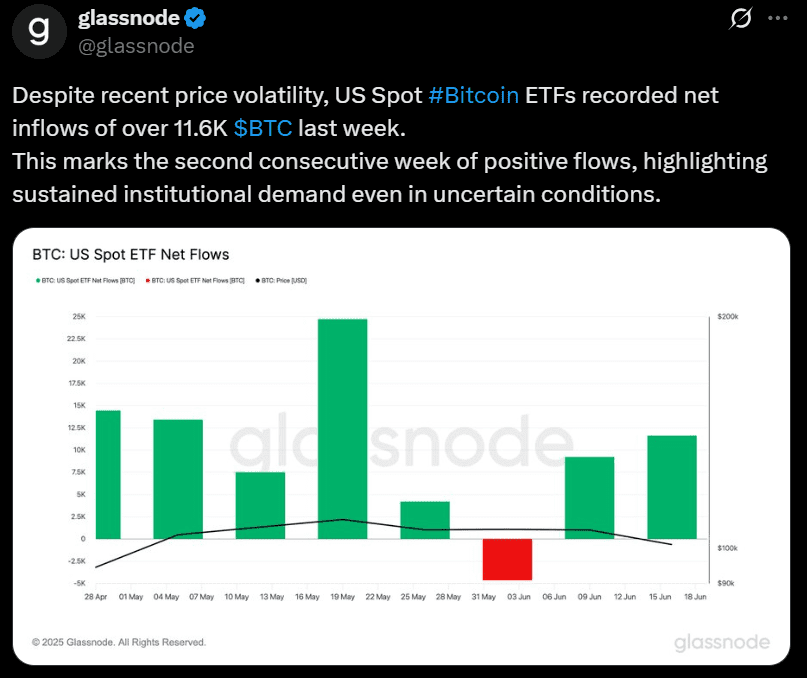
Meanwhile, spot Bitcoin ETFs recorded 11.6K BTC in net inflows last week, according to another Glassnode post. This marked the second consecutive week of positive institutional demand, reinforcing the view that underlying accumulation is active, even if price remains rangebound.
Tactical setups may favor short trades near resistance, but structural signals suggest strong foundational support from longer-horizon capital.
HYPE Price Said “Not Today” To The Bear Gods
HYPE token price action during the recent turmoil earned the coin a Game of Thrones reference. The Hyperliquid token started gaining even as Bitcoin, Sui, and others were still in a bearish freefall during the recent crash.
The price hovered around $37 at writing, marking a 24.6% recovery from its June 21 lows. Crucially, the long/short ratio remained flat at 0.9984, reinforcing the absence of leveraged imbalance typically seen during short squeezes or overextended rallies.
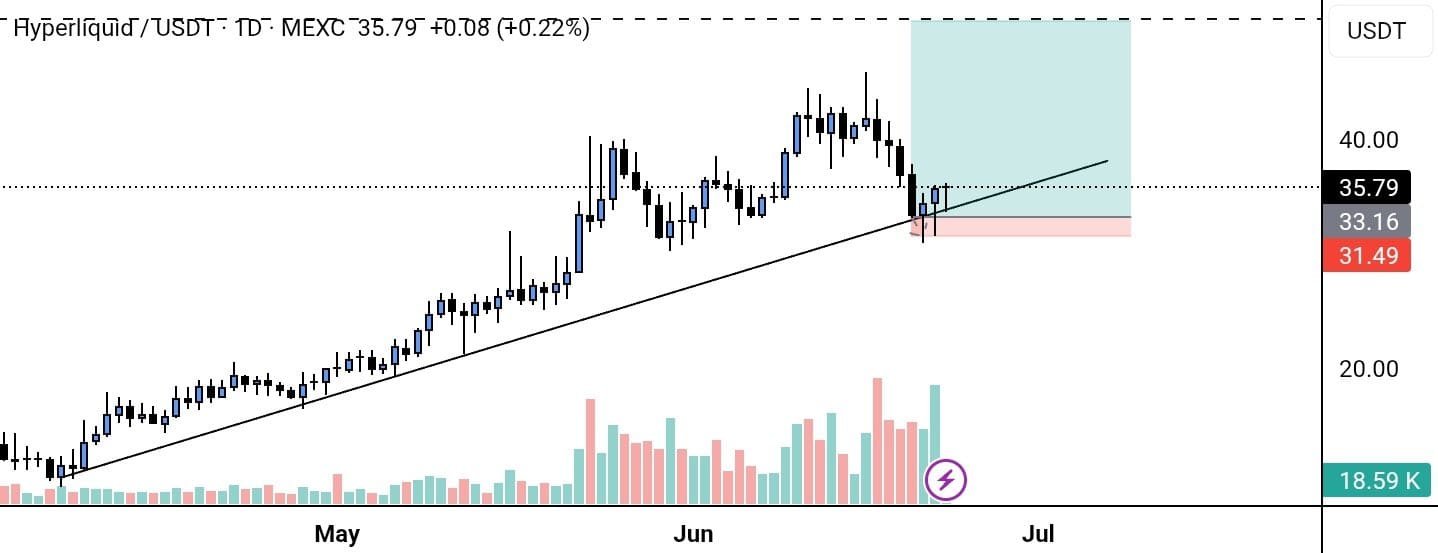
Structurally, crypto analyst account moonX noted in a post that HYPE has maintained its April-to-June uptrend, avoiding any breakdown despite marketwide turbulence. Technical indicators confirm a possible continuation: RSI rebounded from 49, avoiding the oversold zone, while MACD began curling upward, hinting at renewed bullish momentum.
The volume profile shows increased participation after the trendline retest, a key confirmation of buying conviction.
Fundamentals within the Hyperliquid ecosystem also appear to be strengthening. Protocol TVL climbed to $1.67 billion, daily protocol revenue reached $3.5 million, and 24-hour perps volume exceeded $12 billion. In addition, the ecosystem’s decentralized exchange handled nearly $500 million in daily flow, while bridged capital remained above $5.8 billion.
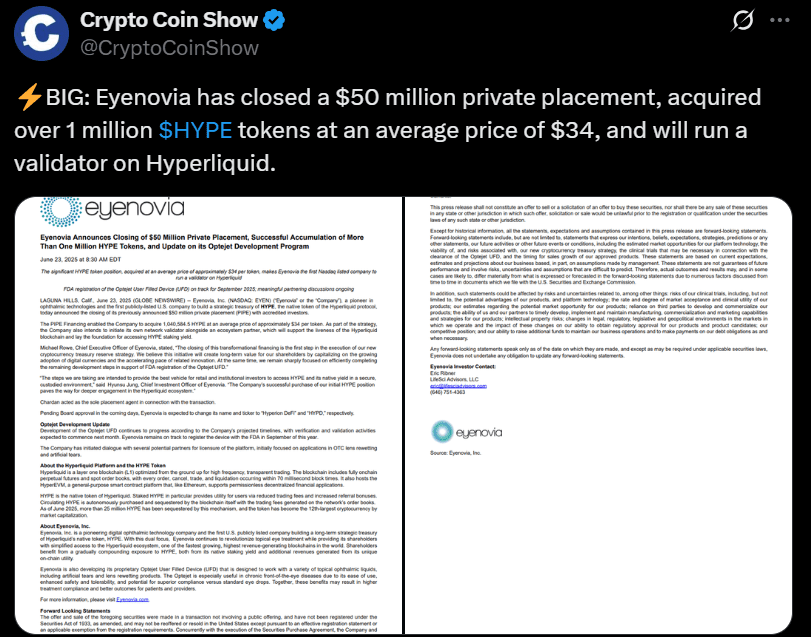
Adding to this backdrop, Eyenovia’s $50 million private placement secured over 1 million HYPE tokens at an average cost of $34. The firm also confirmed plans to run a validator on Hyperliquid, effectively aligning itself with the chain’s long-term trajectory. This development anchors the $34 region as a potential accumulation zone backed by real capital allocation.
SUI Price Rebounds From Breakdown
SUI price staged a sharp intraday recovery after dipping below the $2.5 support, closing the session with a 15% daily gain on June 23. The token’s price action was nothing out of the ordinary, with SUI and Bitcoin painting a near-identical price chart, like most wider market tokens. However, the SUI price failed to capture the $3 price level, which marks the upper boundary of the multi-week descending trendline.

Crypto Rand, who flagged the setup on June 23, noted that SUI had “fully recovered from the war shakeout” and highlighted the $3 level as the key breakout point. According to Rand, clearing this resistance would confirm a trend reversal for the token and open the path for full bullish continuation.
The accompanying chart showed SUI still confined within a clean downtrend channel, with the lower wick rebounding near $2.4, a previously marked support zone. Rand’s analysis points to $3 as both psychological and technical resistance—failure to break it would likely reintroduce supply pressure.
A confirmed close above $3 with follow-through would invalidate the descending channel and flip the bias to bullish. Until then, the move may be corrective. Smart money likely awaits confirmation, with short-term traders defending the $2.4–$2.5 zone while watching for trendline rejections above. Momentum remains reactionary, not yet directional.
