

YEREVAN (CoinChapter.com) – The crypto market faced more headings in this weak, as traders brace for more losses ahead. Thus, unsurprisingly, many altcoins formed bearish patterns, copying Bitcoin (BTC). Here are several of them:
#1 Hedera (HBAR) Daily Price Chart
Hedera (HBAR) traded at $0.06 on Oct 13, after a Bitcoin-copycat week. The altcoin charted within a pattern dubbed the ‘descending triangle’ since June 2022. The latter entails a dropping resistance and flat support. They enclose the price action and prevent sharp moves in either direction.

If HBAR confirms the pattern by dropping below the support, the target price will stand at $0.01, 80% below the current price.
Meanwhile, a relative rise in the trading volumes contradicted the bearish conclusion, hinting at a possible price appreciation based on heightened investor interest. Higher highs on the RSI graph (purple graph below the trading volumes) testified the same.
#2 Richquack (QUACK) Daily Price Chart
Richquack (QUACK) traded at $2.53e-9 in the Asian-Pacific session after a 378% explosive rally month-to-date. The altcoin then declined over 30% on Oct 13, hinting at an upcoming wipeout.
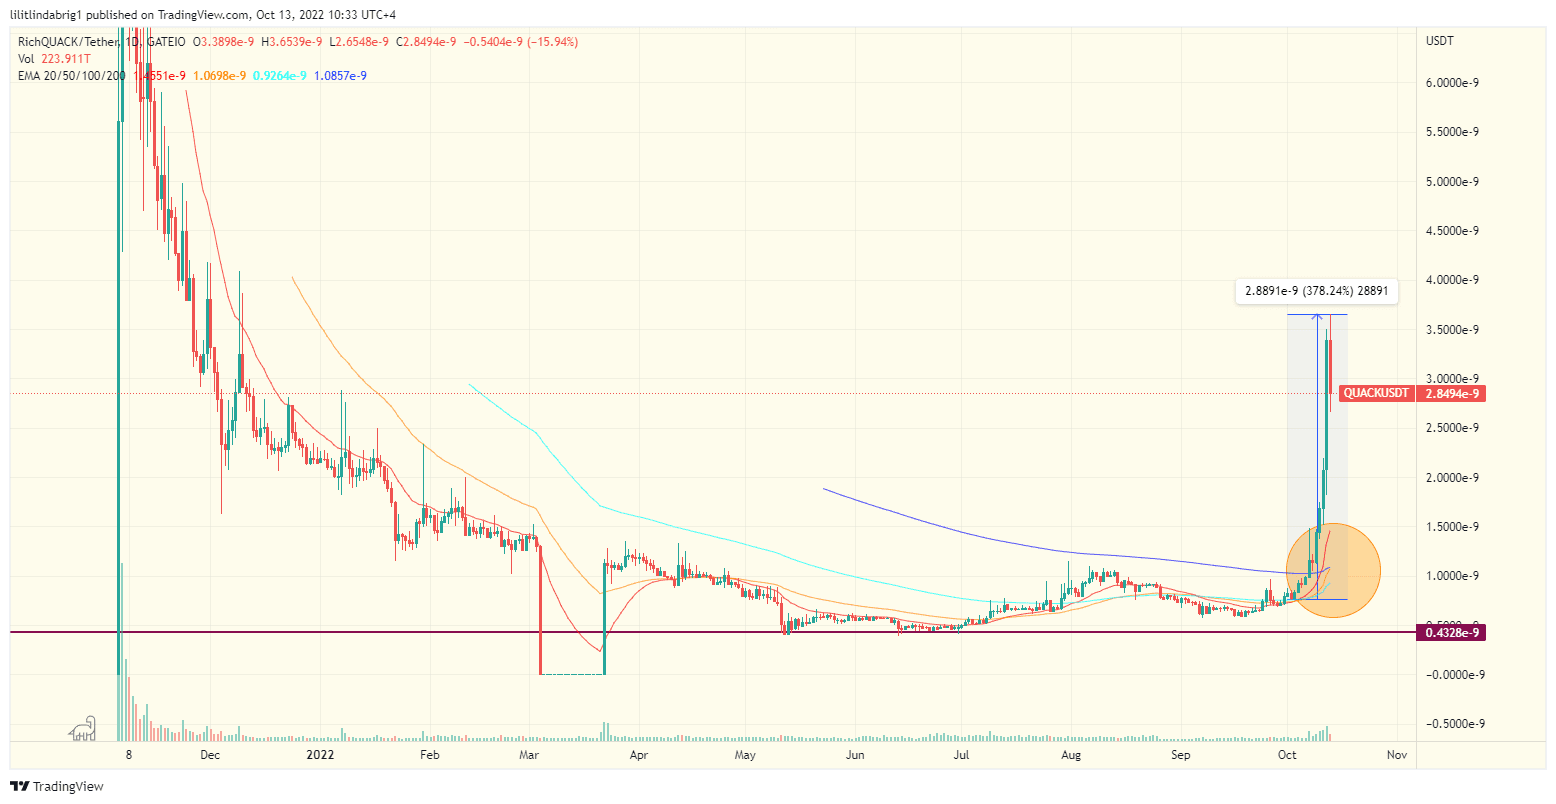
Moreover, the declining trading volumes backed the bearish prediction.
#3 Kasta Coin (KASTA) Daily Price Chart
Kasta coin (KASTA) exhibited a similar pattern to the descending triangle. However, the coin lost over 94% since late January and traded at $0.04 on Oct 13.
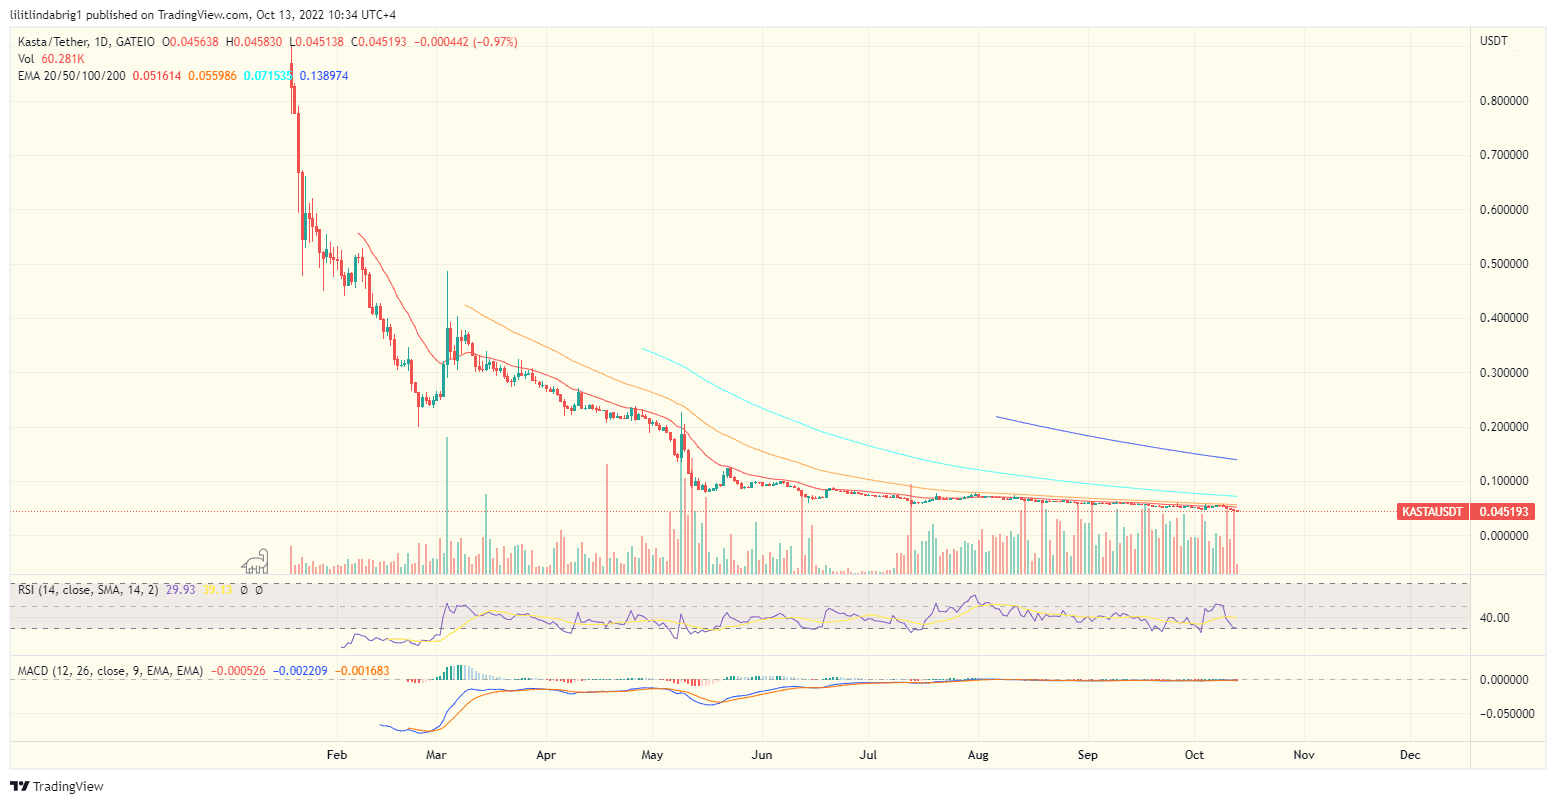
Moreover, KASTA traded below 20, 50, 100, and 200-day exponential moving averages, as seen in the chart above. The trading volumes were indecisive, yoyoing around the same level for months.
#4 Litecoin (LTC) Daily Price Chart
Litecoin (LTC), the oldest altcoin on the list, traded at $50.6 on Oct 13 after forming, but not yet confirming a descending triangle. If the bearish prediction pans out, LTC could drop to approximately $20, or over 60% lower than the current value.
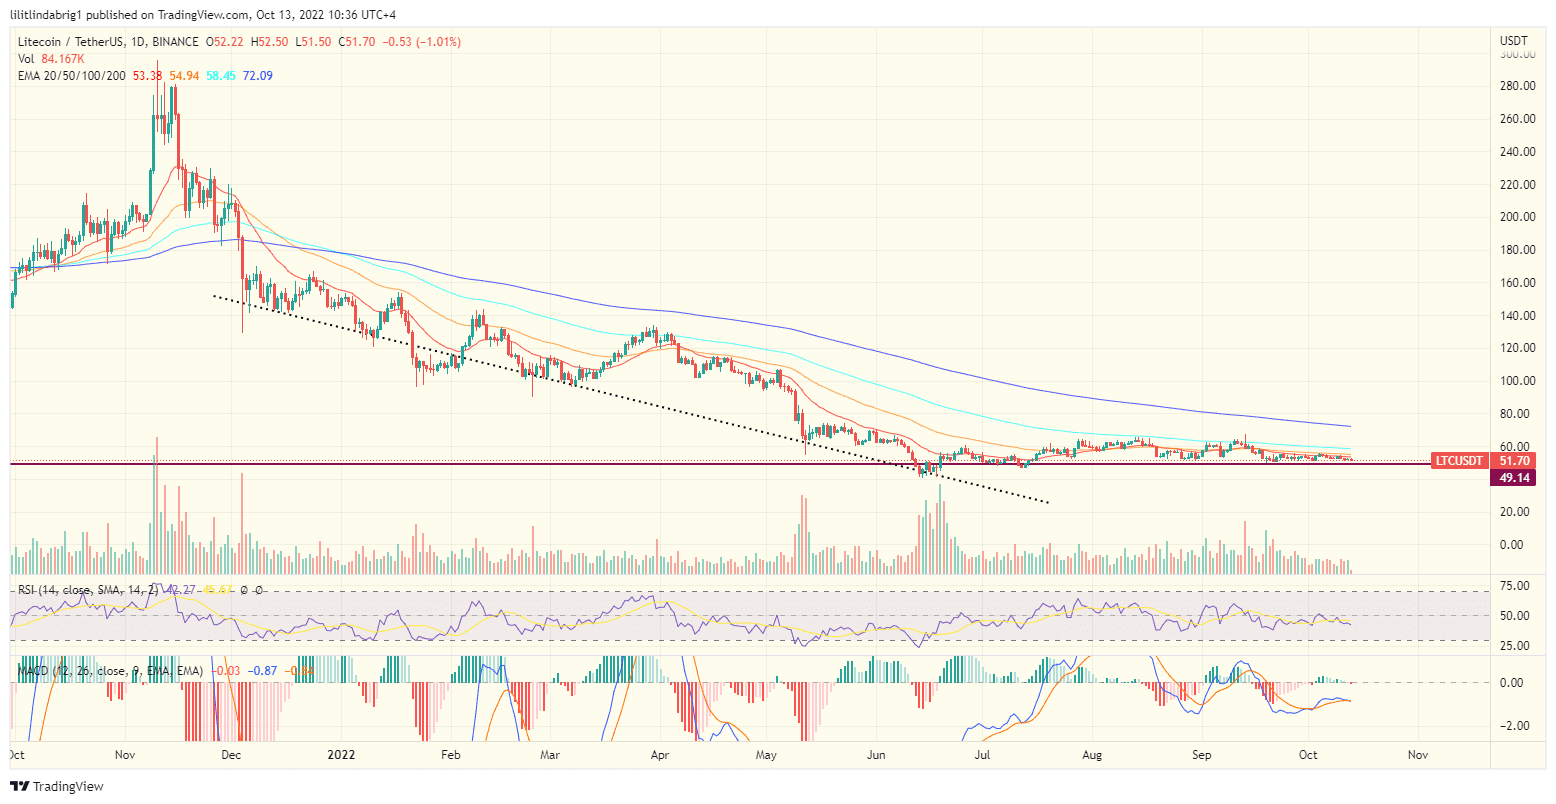
Litecoin also traded below the EMA-20, 50, 100, and 200, forecasting more pain ahead.
#5 Apecoin (APE) Daily Price Chart
Apecoin (APE) did not fall behind its peers and traded within its own descending triangle. APE/USD exchange rate stood at $4.37, risking dropping to nearly 0.
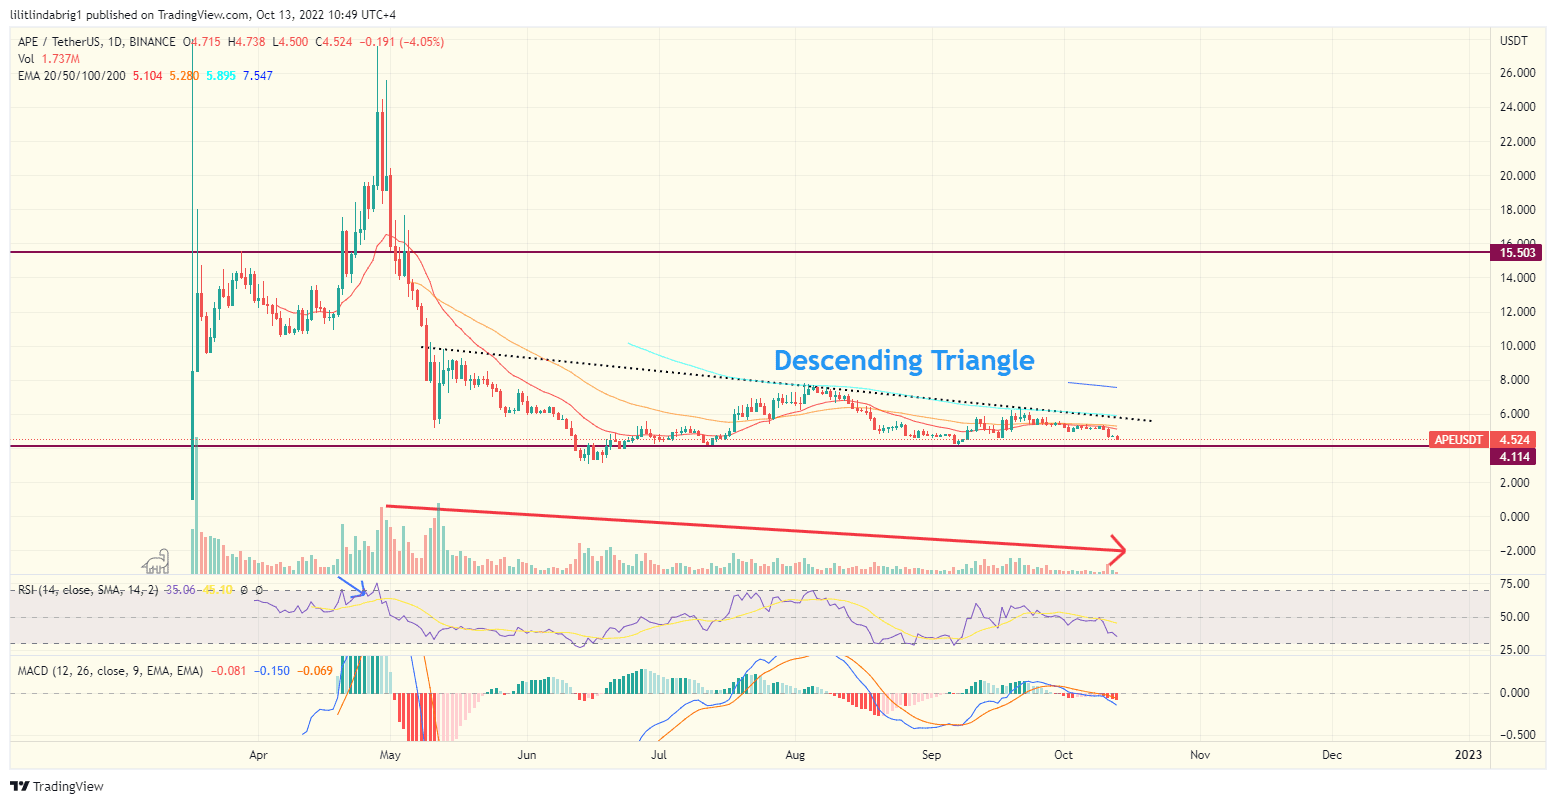
Moreover, APE’s trading volumes have been declining since May, backing the bearish prediction.
#6 Cardano (ADA) Daily Price Chart
Cardano (ADA), the 8th largest crypto by market cap, traded at$0.36 on Oct 13. Similarly to other entries on the list, ADA charted within a descending triangle. However, unlike other altcoins, the Cardano token confirmed the setup, sliding below the support.
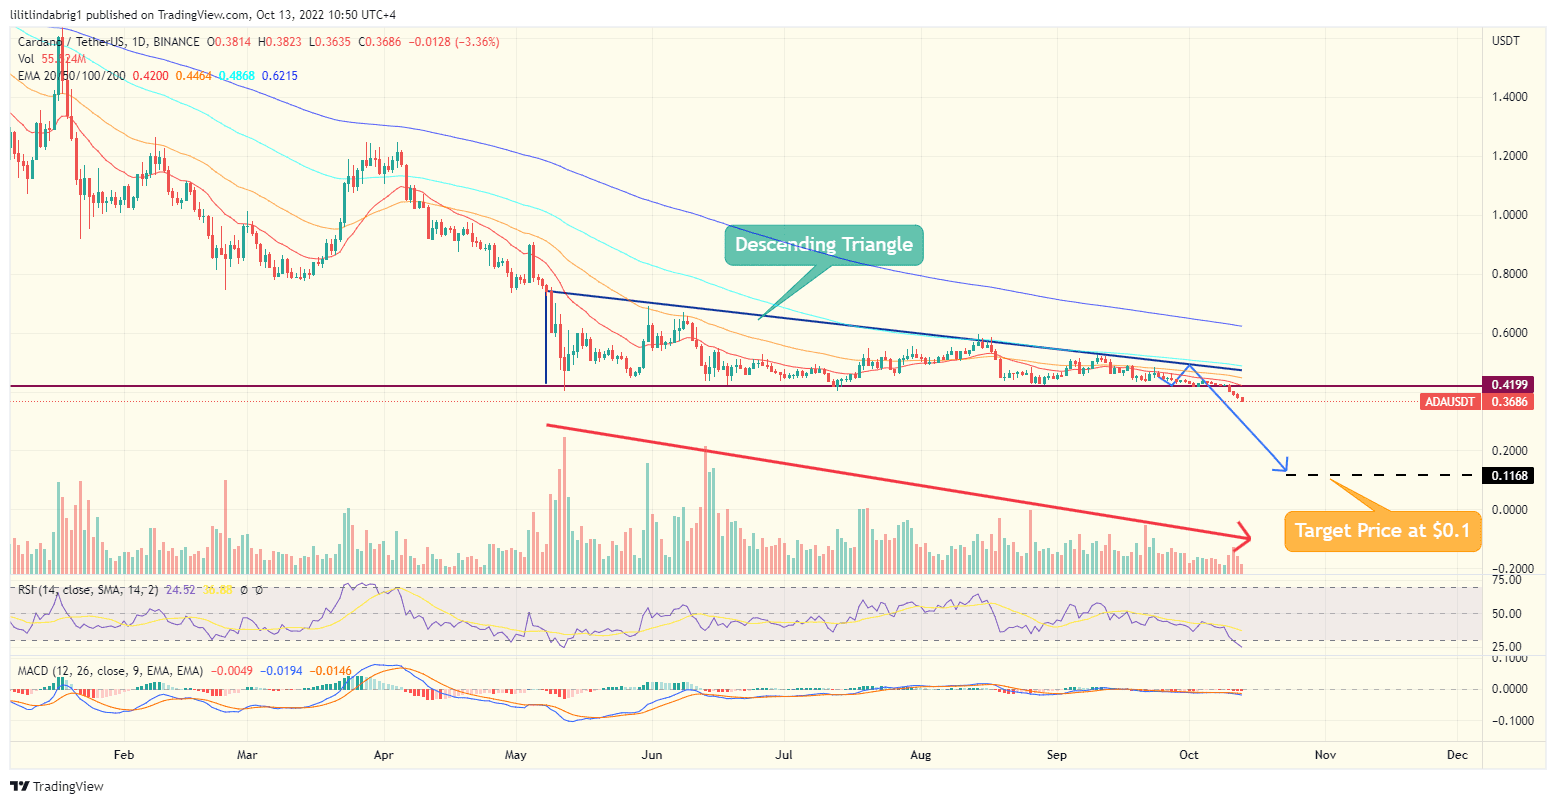
Moreover, ADA also experienced a trading volume decline, reflecting investors’ reluctance to take risks and bet big on Cardano.

… [Trackback]
[…] There you will find 19009 more Info on that Topic: coinchapter.com/hedera-hbar-richquack-quack-kasta-coin-kasta-litecoin-ltc-apecoin-ape-cardano-ada-cryptocurrency-price-today/ […]
… [Trackback]
[…] Info on that Topic: coinchapter.com/hedera-hbar-richquack-quack-kasta-coin-kasta-litecoin-ltc-apecoin-ape-cardano-ada-cryptocurrency-price-today/ […]
… [Trackback]
[…] Find More to that Topic: coinchapter.com/hedera-hbar-richquack-quack-kasta-coin-kasta-litecoin-ltc-apecoin-ape-cardano-ada-cryptocurrency-price-today/ […]
… [Trackback]
[…] Find More on that Topic: coinchapter.com/hedera-hbar-richquack-quack-kasta-coin-kasta-litecoin-ltc-apecoin-ape-cardano-ada-cryptocurrency-price-today/ […]
… [Trackback]
[…] Find More Info here to that Topic: coinchapter.com/hedera-hbar-richquack-quack-kasta-coin-kasta-litecoin-ltc-apecoin-ape-cardano-ada-cryptocurrency-price-today/ […]
… [Trackback]
[…] Info to that Topic: coinchapter.com/hedera-hbar-richquack-quack-kasta-coin-kasta-litecoin-ltc-apecoin-ape-cardano-ada-cryptocurrency-price-today/ […]
… [Trackback]
[…] Read More on on that Topic: coinchapter.com/hedera-hbar-richquack-quack-kasta-coin-kasta-litecoin-ltc-apecoin-ape-cardano-ada-cryptocurrency-price-today/ […]
… [Trackback]
[…] Find More to that Topic: coinchapter.com/hedera-hbar-richquack-quack-kasta-coin-kasta-litecoin-ltc-apecoin-ape-cardano-ada-cryptocurrency-price-today/ […]