
- The Bitcoin MVRV paints a semi-bullish outlook for BTC later this year
- Current trading momentum remains overwhelmingly bearish
- The Bitcoin bull run of 2021 remains in effect, but will require a signficant push to surpass $65,000
BELGIUM (CoinChapter.com) — Although the current Bitcoin price momentum may not seem promising, the overarching metrics tell a different story. People who pay attention to the market-value-to-realized-value (MVRV) aspect will know Bitcoin is in a good spot. The current ratio is akin to the levels seen between January and March 2017.
Also read: Bitcoin is not going above $40K this year, says Singapore exchange head.
MVRV Paints A Bullish Signal
The MVRV ratio depicts an asset’s market cap ratio to its realized cap for those unfamiliar with the concept. It is a tool that applies to any financial market or investment. Comparing the current market cap with the realized cap can help determine whether an asset is above, below, or near a ‘fair value”. Those who perform technical analysis want to pay attention to the MVRV, as it can help determine tops and bottoms. For Bitcoin, it is an essential metric when looking at the much bigger picture.
Per CryptoQuant, it would appear there is some excitement regarding the MVRV. However, despite the Bitcoin price topping at nearly $65,000 earlier this year, the MVRV did not hit the same level as during the previous bull run. Additionally, current price levels indicate we are at the same part of the bull market cycle as seen between January and March 2017. That three-month period eventually resulted in Bitcoin surpassing $10.000 and topping out at nearly $20,000 months later.
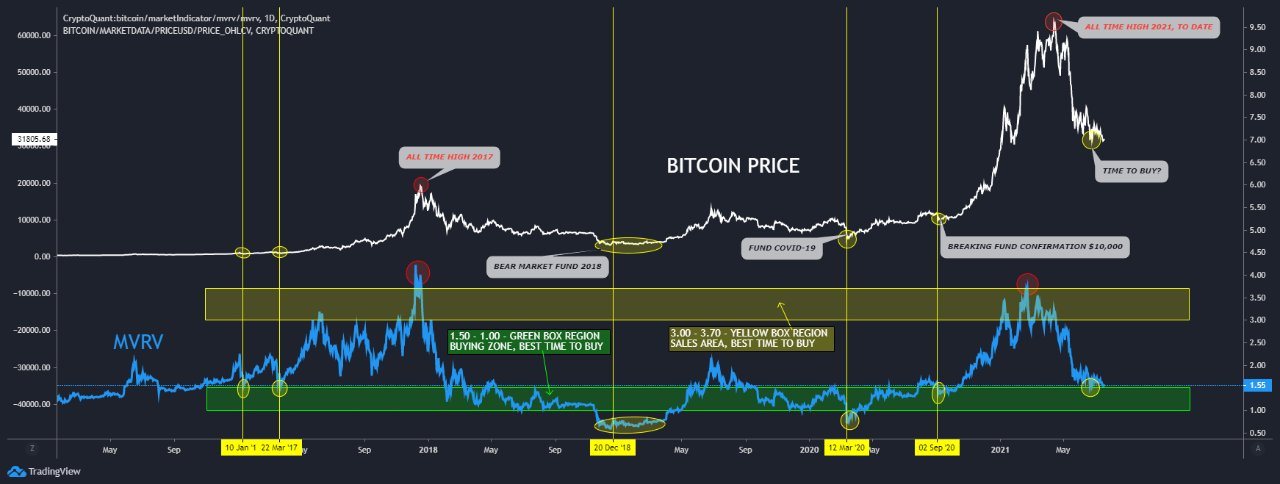
As such, it would seem there is room for cautious Bitcoin price optimism. Judging by the MVRV, the bull run for 2021 and early 2022 is not over yet. However, as is the case with any metric, the MVRV is not necessarily a signal to perform financial actions. Bitcoin remains a very volatile asset, and its price can go up and down at any moment. Thus, basing one’s market actions on one metric is not a clever play, although it provides an exciting aspect to analyzing the future Bitcoin price momentum.
What Do Other Bitcoin Indicators Say?
It is often difficult to make sense of cryptocurrency market momentum. For Bitcoin, the downtrend is still in effect, even though there is no apparent reason for it. Moreover, the technical indicators do not look too promising either, indicating the downward pressure may not relent just yet.
The positive indicator is the MA200 which still shows a slight upward angle despite the recent market drop. However, the MA20 and MA50 keep trending lower and have crossed the MA200 in a bearish fashion a while ago. More often than not, a bearish cross is a sign of lower prices looming on the horizon.
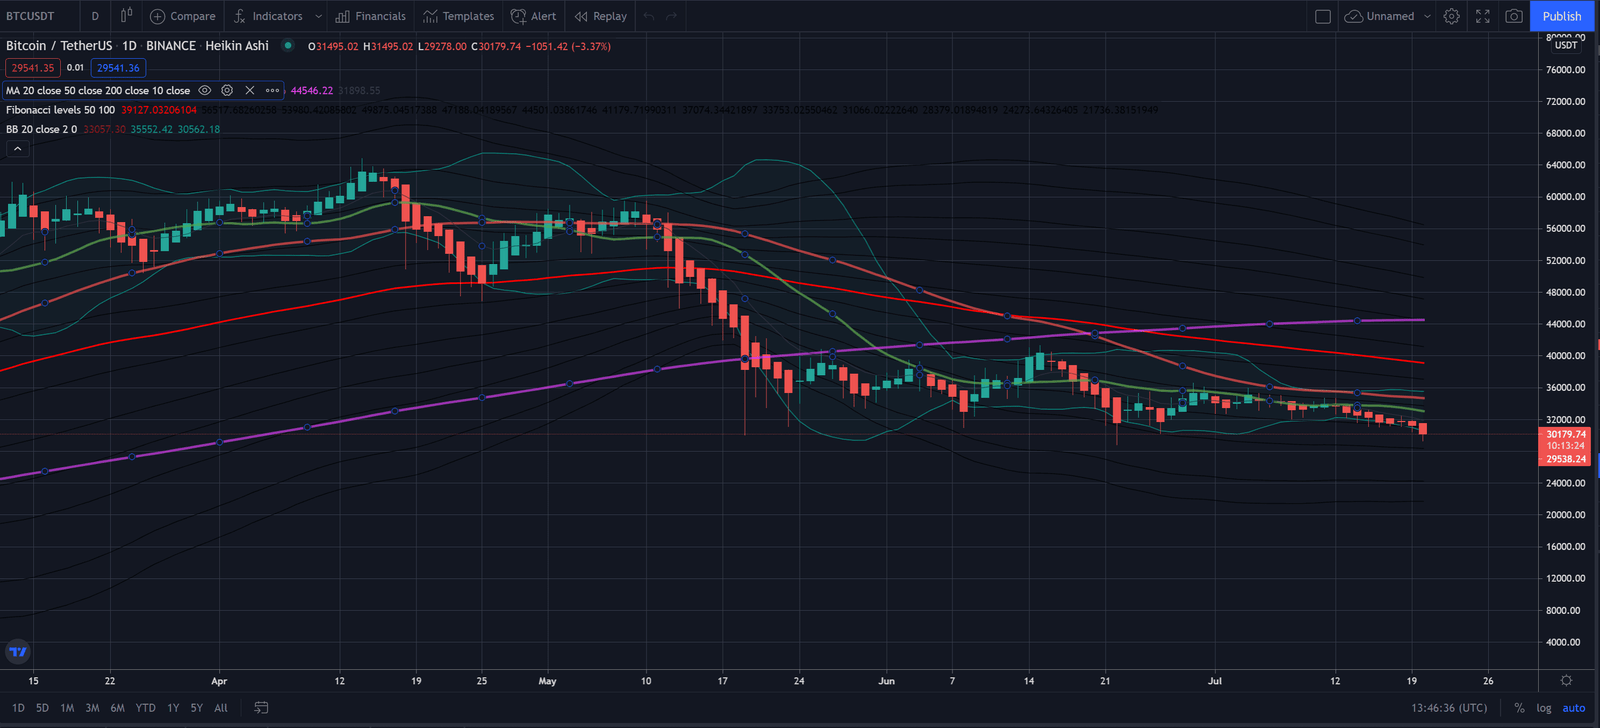
The Bollinger Bands remain relatively narrow, although the last widening of the BBs triggered a price drop by over $20,000 over several weeks. A narrowing of Bolinger Bands can hint at accumulation.
All sell orders are bought up quickly, even if the price keeps drifting lower. That can be interesting when combining it with the MVRV findings. Unfortunately, Bitcoin remains a “Strong Sell” even at this price; thus, a short-term price reversal seems unlikely.

… [Trackback]
[…] Find More to that Topic: coinchapter.com/bullish-bitcoin-indicator-that-sent-prices-from-11k-to-65k-flashes-again/ […]
… [Trackback]
[…] Read More to that Topic: coinchapter.com/bullish-bitcoin-indicator-that-sent-prices-from-11k-to-65k-flashes-again/ […]
… [Trackback]
[…] Read More here on that Topic: coinchapter.com/bullish-bitcoin-indicator-that-sent-prices-from-11k-to-65k-flashes-again/ […]