

Key Takeaways:
- Tezos (XTZ) value gained 15% in 24 hours and might gain more based on a bullish technical setup.
- The weekly chart shows a pivotal moment for XTZ.
YEREVAN (CoinChapter.com) – XTZ, the native token of smart contract platform Tezos, traded at $3 in Friday’s London session after a 15% jump in 24 hours. The uptrend came in the wake of a massive crypto sell-off wave brought on by the raging military conflict between Russia and Ukraine.
However, the bullish “Falling Wedge” setup suggested a reversal ahead for XTZ. In detail, the formation consists of two converging trendlines with a negative slope. They encompass the price action and lower the swing as the pattern progresses.

The digital asset has not yet completed the pattern, which means XTZ might eye more ups and downs before breaking out. The value could still fall back and retest the support. In that case, Tezos bears could expect a 25% decline to $2.20.
However, according to the technical indicators, a 30% uptrend to $4.00 is in the cards before the possible breakout.
Also read: Ukraine invasion sparks debate on interest rate hikes — what does it mean for Bitcoin?As of Feb. 25, XTZ’s future is dependent on the turbulent macroeconomic situation and, more specifically, Bitcoin’s price action. The latter has been undecisive and consolidating sideways for days.
Moreover, the Tezos weekly chart revealed an additional significant support line that could back XTZ.
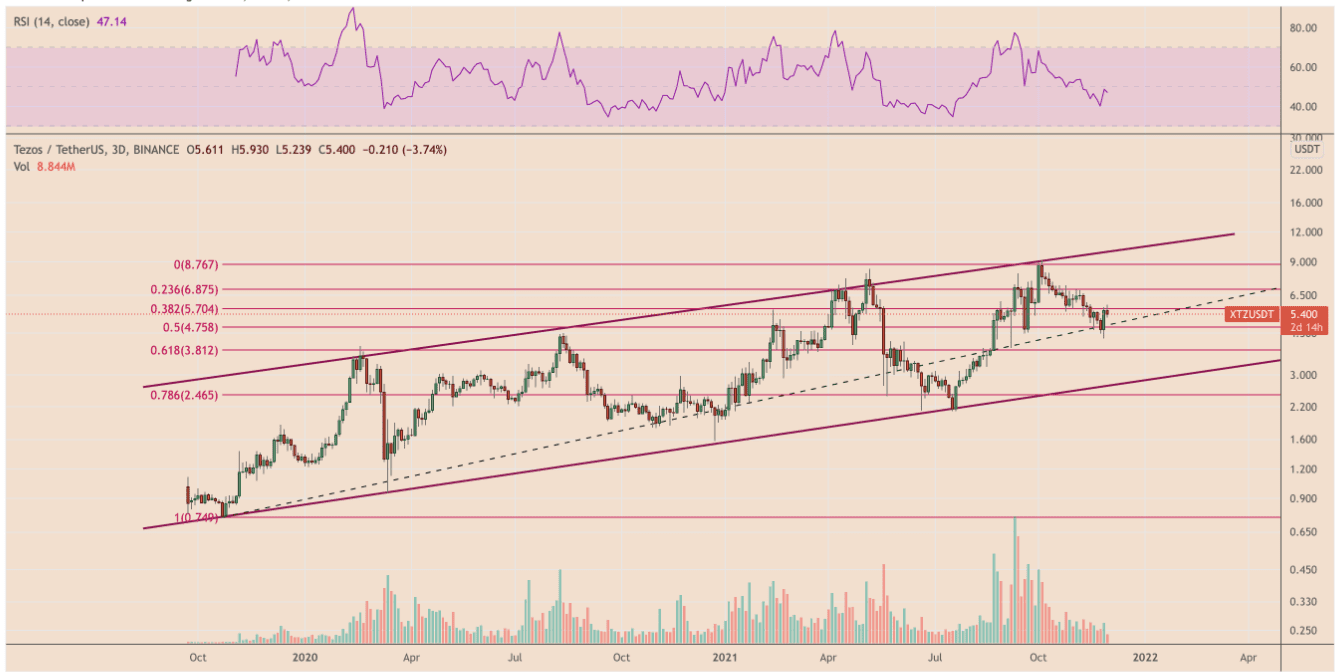
Tezos (XTZ) weekly chart
A trendline with a positive slope has supported XTZ for the previous two years, shown on the chart below. Furthermore, the digital asset arrived at the support in the current week and could bounce back in the coming days. Notably, XTZ has not yet closed a week below the said trendline.

As mentioned, the token price gained 15% in the previous 24 hours. However, the low trading volumes on the weekly chart might not put enough weight behind the rally.
Furthermore, the digital asset’s relative strength index (RSI: purple graph at the bottom) is charted below 50. In detail, the RSI is a momentum indicator, and reading between 30 and 50 shows that the traders have low return expectations from XTZ returns.
Also read: 5 crypto assets that suffered the most due to Ukraine-Russia Crisis.The upcoming sessions and the events unfolding around the Russia/Ukraine conflict will shed more light on the future of Bitcoin and, by extension, altcoins, including Tezos.

… [Trackback]
[…] Find More to that Topic: coinchapter.com/can-this-tezos-xtz-bullish-reversal-setup-help-break-the-ukraine-russia-jinx/ […]
… [Trackback]
[…] Find More to that Topic: coinchapter.com/can-this-tezos-xtz-bullish-reversal-setup-help-break-the-ukraine-russia-jinx/ […]
… [Trackback]
[…] Info on that Topic: coinchapter.com/can-this-tezos-xtz-bullish-reversal-setup-help-break-the-ukraine-russia-jinx/ […]
… [Trackback]
[…] Find More Information here on that Topic: coinchapter.com/can-this-tezos-xtz-bullish-reversal-setup-help-break-the-ukraine-russia-jinx/ […]
… [Trackback]
[…] Find More on that Topic: coinchapter.com/can-this-tezos-xtz-bullish-reversal-setup-help-break-the-ukraine-russia-jinx/ […]