
Yerevan (CoinChapter.com) – Cardano’s native token ADA flashed contradictory patterns on its dollar-quoted daily chart. The token traded at $1.51 in the European session Monday after gaining 6 percent over the weekend.
Its upside move also tested the 20-day exponential moving average (EMA-20, blue wave on the chart below) as resistance before correcting lower into the session. Meanwhile, technical indicators point to both bullish and bearish outcomes in the sessions ahead.
Bearish signs for Cardano
ADA faced a death cross on June 13, between the EMA-20 and the 50-day simple moving average (SMA-50: red wave). In hindsight, the death cross happens when a short-term moving average loses its upward momentum and crosses down below a long-term moving average. It is a bearish phase predictor. ADA could anticipate further losses until the EMA-20 restores above the SMA-50.
The Relative Strength Index (RSI) lies around 47, which points towards a neutral and indecisive sentiment at the moment (purple chart on the bottom).
When the index shoots above 70, the asset is considered overbought, and the price is likely to decrease. In the opposite situation, when RSI falls below 30, the token could be considered oversold, and the value would likely go bullish.
As of the moment of writing, the RSI is in no way definitive on the ADA/USD chart, showing no progression in either direction.
Read more: Cardano’s ADA risks losing half its value if it breaks this support range
Bullish signs
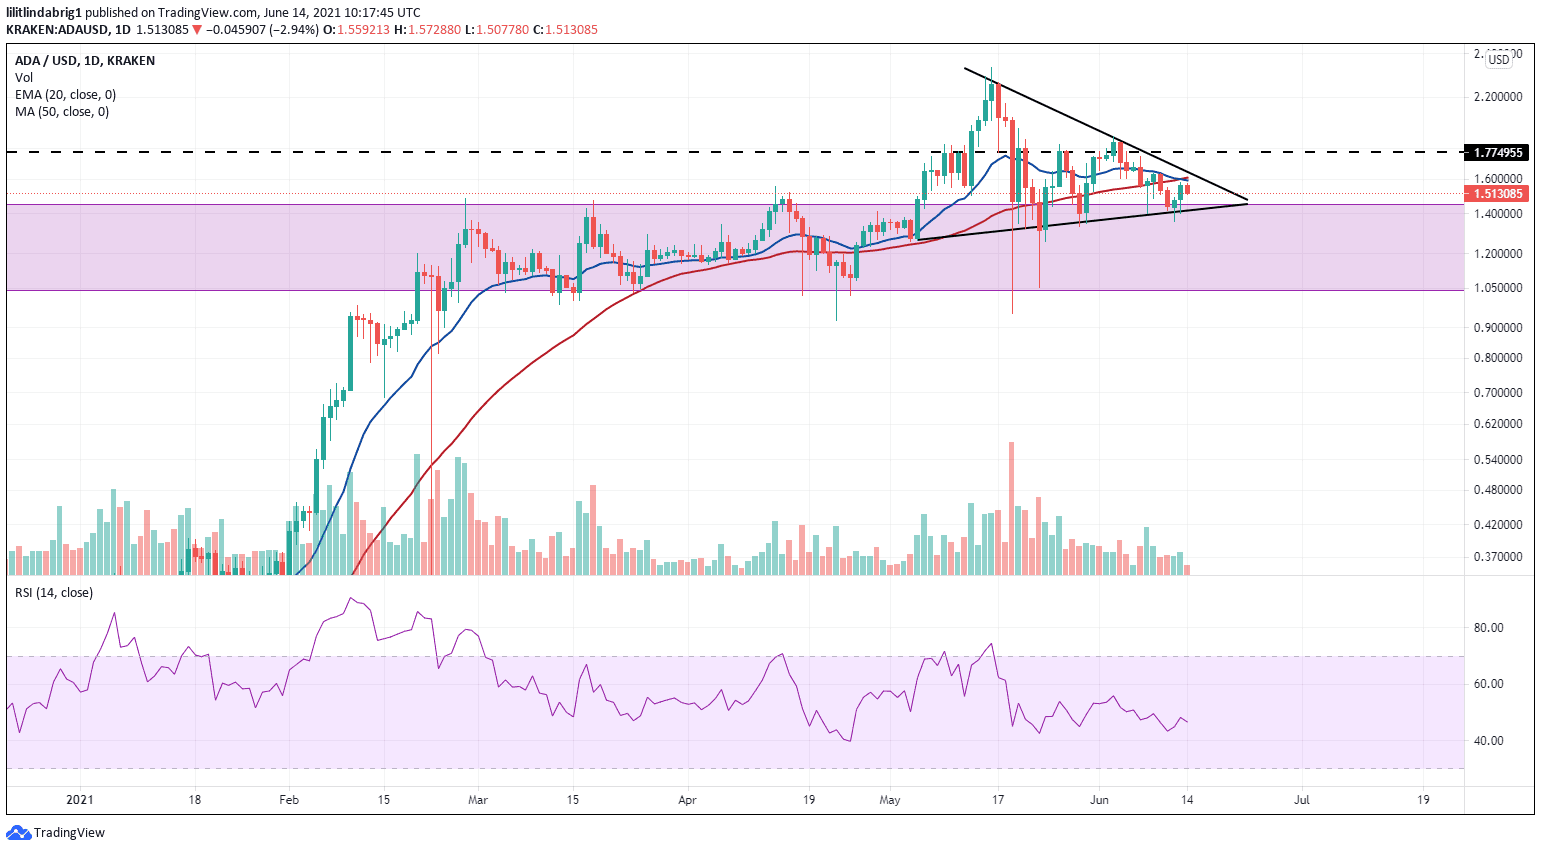
Cardano’s ADA has been forming a symmetrical triangle pattern since May 17. The down-sloping upper trendline prevented sharp breakouts, acting as resistance. The up-sloping support line assisted, hindering declines. The token will complete the triangle in the upcoming sessions.
As the flagpole of the triangle (initial bias preceding the formation) was bullish, the moves further might also be bullish. If so, the price will return to approximately $2.2, i.e., the distance equal to the flagpole.
Cardano also sought support from its former trading channel ($1.05-1.44). The upper margin of the channel provided support on at least 4 separate occasions within the past month. If the price slopes down from the present value, it might use the margin again and bounce back at $1.44.
However, to log the gains promised by the triangle formation, ADA has one more resistance to conquer (dashed line on the chart). The $1.77 price level acted as resistance since mid-May and threatened to cap the bullish attempts again.
Cardano developments
Cardano announced upcoming substantial developments in its blockchain on May 28.
The company introduced Alonzo, a new smart contract rollout. It is aimed to increase the functionality of the whole platform. The development stages are color-coded, and the testnet is currently in the middle of the “Alonzo Blue” stage. It has successfully run the first smart contract on June 11. Next in line is Alonzo White, when developers will introduce the application backend.
Alonzo is the first step in a series of updates earmarked for the next 3 months. After the noted period, Cardano will fully launch smart contracts on its platform, boosting the whole ecosystem.
Read more: Is It Time to Dump Bitcoin and Buy Cardano (ADA)? One Analyst Thinks So
Cardano blockchain platform’s token is showing signs of both bearish and bullish continuations on the daily charts. ADA’s price stood at $1.51 on the London session Monday, trading within a symmetrical triangle. With the triangle on the bullish end and the death cross on the bearish, the upcoming sessions will decide what to expect from Cardano.

… [Trackback]
[…] Find More on that Topic: coinchapter.com/cardano-paints-conflicting-death-cross-and-bullish-triangle-indicators-as-ada-rallies/ […]