YEREVAN (CoinChapter.com) — On April 7, Cardano (ADA) flashed a technical warning known as a death cross on the daily chart, right after falling brutally in a market-wide selloff led by Donald Trump’s global tariff announcement.

A death cross occurs when an asset’s 50-period moving average (MA 50), shown in red, crosses below the 200-period moving average (MA 200), shown in blue. Traders see this signal as a possible start of a long-term downtrend. In ADA’s case, the 50-200 day EMA crossover occurred at nearly $0.72.
Normally, when such a crossover appears, the price continues to fall. But instead of dropping further, ADA bounced sharply hours after the death cross appeared. As of April 8, the ADA price was over $0.60 compared to $0.53 a day ago.
The volume increased during this bounce, suggesting strong buying interest. Also, the RSI (Relative Strength Index), close to oversold levels near 35, began moving slightly. This indicates that the selling pressure may be easing in the short term, and buyers are stepping in.
So, even though the death cross usually points to weakness, ADA showed strength by bouncing back with momentum right after the bearish signal.
ADA Price Must Hold This Critical Support Or…
Crypto analyst Mr. Brownstone highlighted $0.50 as the most important support level for Cardano (ADA), aligning with the orange area in the chart below.
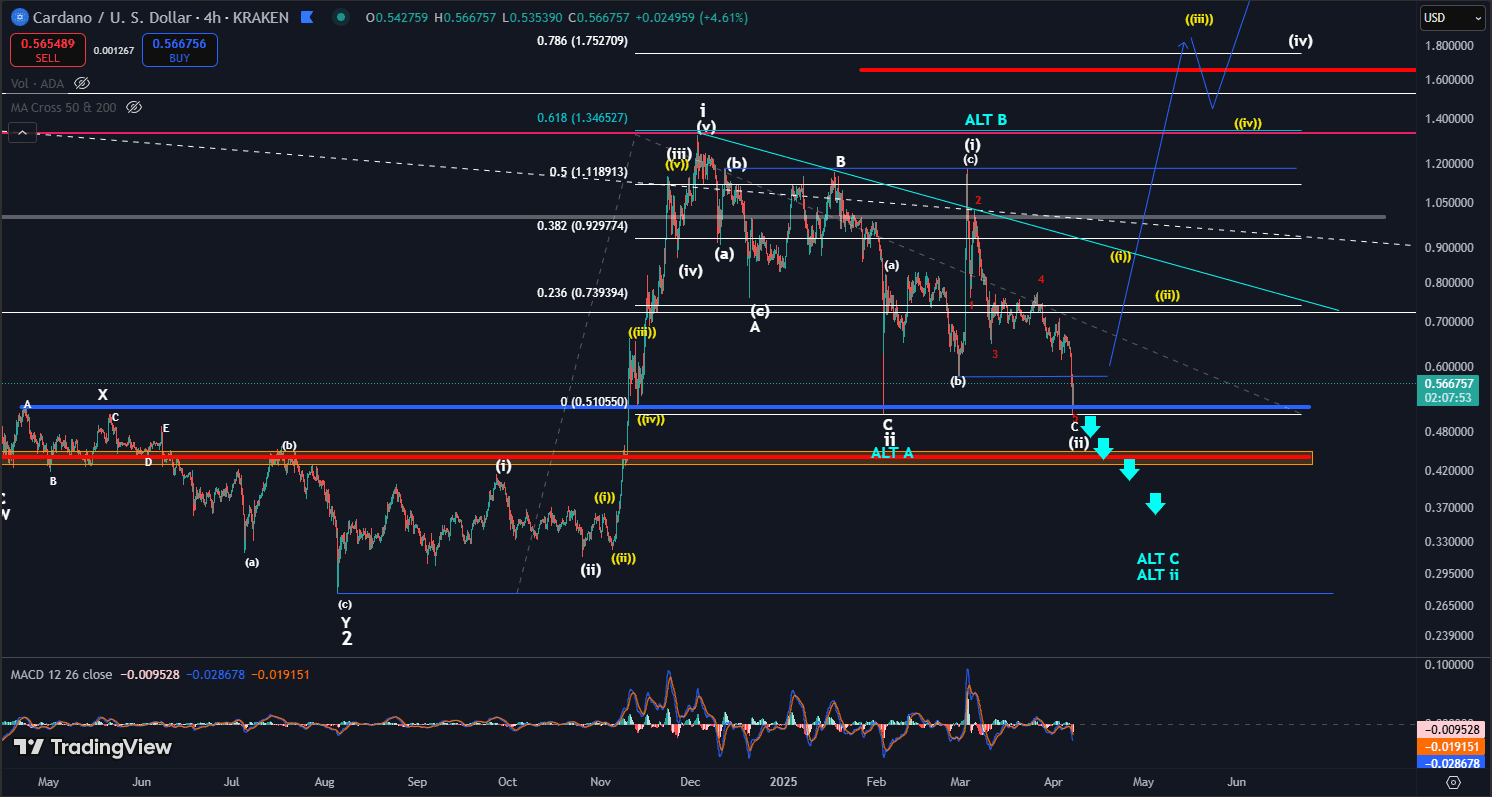
He pointed to this line in his chart where the price has bounced thrice since November 2023. Each time ADA dropped close to $0.50, it reversed and moved higher. That tells traders this price is acting as strong support — a floor limiting the market’s downside bias.
If the price breaks below $0.50, this long-term support has failed, possibly leading to a larger drop toward $0.25. Conversely, a strong rebound from $0.50 may lead ADA’s price toward $0.70, the first resistance target in view per Mr. Brownstone’s chart.
Cardano Technical Analysis: ‘Broadening Wedge’ Suggests 100% Price Boom by June
Cardano (ADA) is eyeing a potential rebound as it consolidates within a broadening wedge on the weekly chart. After bouncing off the lower trendline, ADA trades near $0.605, up over 5% this week.

The wedge suggests a possible breakout toward $1.30—the previous swing high—if buying pressure returns. However, the RSI recently broke below its support trendline, hinting at weakening momentum. A recovery above the 50 mark would signal renewed strength.
ADA also sits between key EMAs: the 50-week at $0.662 and the 200-week at $0.547. A close above the 50-week EMA would reinforce the bullish setup. Traders now await a wedge breakout and RSI recovery to confirm upside continuation.
